In the vast, turbulent ocean of the stock market, most traders are fixated on the individual waves—the daily gyrations of single stocks. But the seasoned navigator knows that understanding the deeper, more powerful currents is what truly propels a vessel forward. In market terms, these currents are sector rotation—the silent, massive migration of capital from one industry group to another, driven by the shifting tides of the economic cycle, investor sentiment, and macroeconomic forces.
For the swing trader, who operates in the sweet spot between the noise of day trading and the patience of long-term investing, mastering sector rotation is not just an advantage; it’s a superpower. It’s the difference between fighting the riptide and riding it. This guide is your chart to these currents. We will move beyond theory into a practical, actionable framework for identifying, analyzing, and capitalizing on the next leading industry, allowing you to align your swing trades with the most powerful force in the market: institutional money flow.
Part 1: The Foundation – Understanding Sector Rotation
What is Sector Rotation and Why Does It Matter to Swing Traders?
Sector rotation is the systematic movement of investment capital from one stock market sector to another as investors anticipate the next phase of the economic cycle. It’s not a random event; it’s a logical, albeit complex, process driven by the collective intelligence (and fear) of the market.
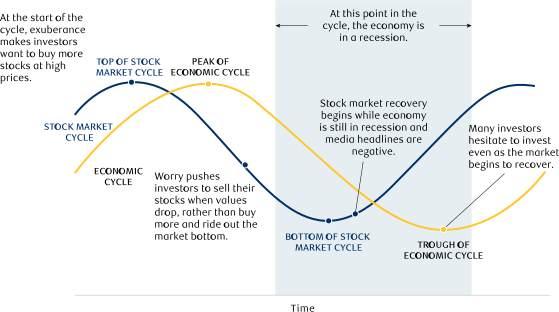
Think of the economy as having seasons. Just as you wouldn’t plant crops in the winter, investors don’t typically flock to construction stocks during a recession. They rotate into defensive positions. This behavior is both predictive and reactive.
For the swing trader, this is critical for two reasons:
- The Wind at Your Back: A trade placed in a sector that is beginning to rotate into favor has a significantly higher probability of success. You are trading in the direction of massive institutional capital—billions of dollars flowing in from pension funds, hedge funds, and mutual funds. This provides a powerful tailwind that can amplify gains on individual stock picks.
- Risk Mitigation: Conversely, being long a stock in a sector that is rotating out of favor is like swimming against a tsunami. No matter how good the individual company’s earnings are, it can be overwhelmed by the sector-wide selling pressure. Identifying these weakening sectors allows you to avoid value traps and dead money.
The Psychological and Macroeconomic Engine
The driver of this rotation is a combination of macroeconomic data and market psychology. Key indicators that institutional investors monitor include:
- Interest Rates & Federal Reserve Policy: The cost of money dictates corporate and consumer behavior. Rising rates hurt capital-intensive sectors like Technology and Real Estate, while benefiting Financials.
- Inflation Data (CPI, PPI): The trajectory of inflation signals the economy’s temperature and dictates Fed policy.
- Employment Figures: A strong job market fuels consumer spending, benefiting Discretionary sectors.
- GDP Growth: The overall health of the economy.
- Corporate Earnings & Guidance: Forward-looking statements from companies provide clues about the future business environment.
As these data points evolve, the market’s narrative about the economy shifts from “recovery” to “expansion” to “slowdown” to “recession.” Sector rotation is the physical manifestation of that changing narrative.
Part 2: The Core Framework – The Sector Rotation Clock
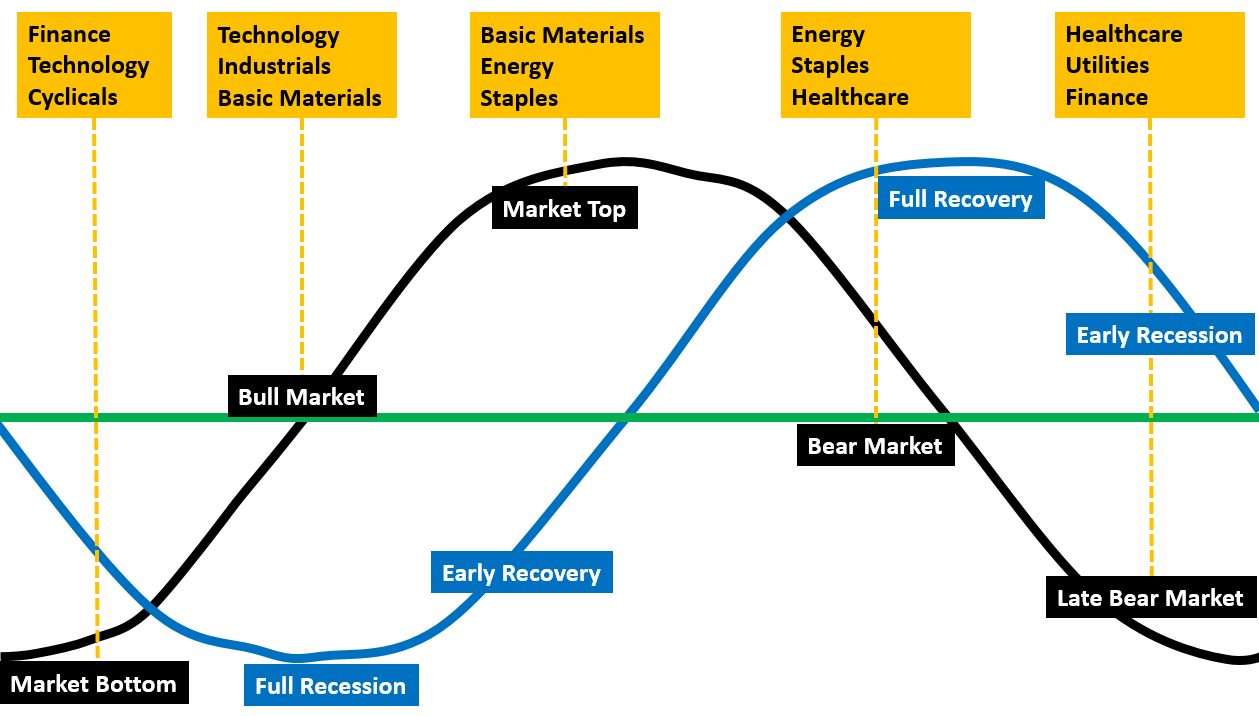
The most intuitive model for visualizing sector rotation is the Sector Rotation Clock, which maps the typical outperformance of sectors against the idealized economic cycle. It’s crucial to remember that the market is a discounting mechanism—it prices in the future. Therefore, sectors begin to rotate before the economic data confirms the phase.
Here is a detailed breakdown of the clock, its phases, and the leading sectors in each.
- Note: This is a simplified model. Real-world cycles are messier and can vary in duration and sequence.
Phase 1: Early Cycle – The Rebirth
- Economic Conditions: The economy is bottoming after a recession. The Fed is typically cutting interest rates or has just finished doing so to stimulate growth. Leading economic indicators start to tick up, but the data is still mixed. Pessimism is high, but the seeds of recovery are sown.
- Market Psychology: A transition from despair to hope. “Cautious optimism” is the phrase.
- Leading Sectors:
- Consumer Cyclical (Discretionary): As interest rates fall and stimulus kicks in, consumers start spending on big-ticket items (cars, appliances) and non-essentials. Think Amazon, Home Depot, Starbucks.
- Financials: Banks benefit from a steeper yield curve (the difference between short and long-term rates) and lower default rates. They can borrow cheaply and lend at higher rates.
- Technology: As business confidence returns, companies increase their capital expenditures (CapEx) on software, hardware, and digital infrastructure to gain an edge.
- Swing Trading Focus: Look for strong relative strength breakouts in these sectors. Focus on high-beta names within them that can lead the charge.
Phase 2: Mid-Cycle – The Expansion
- Economic Conditions: The recovery is in full swing. GDP growth is strong, corporate earnings are robust and beating estimates, and employment is rising steadily. The Fed may still be accommodative but starts to signal a potential end to easy money.
- Market Psychology: Confidence and greed. The “wall of worry” has been climbed.
- Leading Sectors:
- Industrials: A booming economy means more trade, transportation, and manufacturing. Companies like Caterpillar, Union Pacific, and Honeywell thrive.
- Materials: Increased industrial activity drives demand for basic resources—chemicals, metals, lumber. Companies like Freeport-McMoRan (copper) and Dow Inc.
- Technology: Continues to perform well as earnings growth validates the early-cycle optimism.
- Swing Trading Focus: Momentum is your friend. Look for sectors and stocks exhibiting strong price and earnings momentum. Pullbacks to key moving averages (like the 50-day EMA) often present prime entry points.
Phase 3: Late Cycle – The Peak
- Economic Conditions: The economy is running hot. Inflation becomes a persistent concern, forcing the Fed to actively raise interest rates to cool things down. Growth peaks and begins to slow. The yield curve may flatten or invert.
- Market Psychology: Euphoria mixed with anxiety. The “smart money” starts to take risk off the table.
- Leading Sectors:
- Energy: Often the last man standing. High inflation and strong global demand push oil and gas prices higher. Companies like Exxon Mobil and Chevron see soaring profits.
- Materials: Can still perform due to high commodity prices.
- Defensive Rotations Begin: Capital starts trickling into safer havens.
- Swing Trading Focus: This is a time for heightened risk management. While Energy can have powerful rallies, be quick to take profits. Start monitoring defensive sectors for early signs of strength.
Phase 4: Recession – The Contraction
- Economic Conditions: GDP contracts, earnings decline, and unemployment rises. The Fed stops hiking and may begin to cut rates again, but the medicine takes time to work.
- Market Psychology: Fear and capitulation.
- Leading Sectors (Defensive):
- Consumer Staples: People still need to buy toothpaste, food, and toilet paper regardless of the economy. Companies like Procter & Gamble, Coca-Cola, and Walmart.
- Utilities: Regulated, stable demand and high dividends are attractive in a volatile, low-growth environment. Companies like NextEra Energy.
- Healthcare: Medical needs are non-discretionary. Pharmaceuticals (Johnson & Johnson) and managed care companies remain relatively resilient.
- Swing Trading Focus: Defensive sectors are not about explosive gains; they’re about capital preservation and steady, low-volatility uptrends. Look for stocks holding above their 200-day moving averages while the market crumbles. Their relative strength is the key signal.
Part 3: The Swing Trader’s Toolkit – How to Spot Rotation in Real-Time
Knowing the theory is one thing; spotting the rotations as they happen is the art of the swing trader. Here is your practical toolkit.
Tool #1: Relative Strength Analysis – Your Primary Compass
This is the single most important technique. You are not just looking for sectors that are going up; you are looking for sectors that are going up faster than the broader market.
How to Implement It:
- Use Relative Strength Ratio Charts: Most charting platforms (TradingView, StockCharts.com) allow you to create a ratio chart by dividing a sector ETF by a broad market ETF like the SPDR S&P 500 ETF (SPY).
- Formula:
[Sector ETF] / [SPY] - Interpretation:
- Ratio Line Rising: The sector is outperforming the S&P 500. This is a bullish rotation signal.
- Ratio Line Falling: The sector is underperforming the S&P 500. Avoid or consider shorting opportunities.
- Formula:
- Actionable Setup: A swing trader might look for a sector whose ratio chart has been consolidating or building a base after a prior downtrend and is now breaking above its 50-day moving average on the ratio chart with strong volume. This is a powerful early signal that institutional money is flowing in.
Tool #2: Intermarket Analysis – Reading the Tea Leaves
The bond, currency, and commodity markets often move before stocks, providing crucial clues.
- The Yield Curve: A flattening or inverting yield curve (when short-term rates rise above long-term rates) is a classic late-cycle warning sign. It signals market expectation of slowing growth and potential Fed rate cuts. This should prompt you to reduce exposure to cyclicals and start watching defensives.
- Commodity Prices: A sustained breakout in key industrial commodities like copper (often called “Dr. Copper” for its PhD in economics) can signal strengthening global demand, a tailwind for the Materials and Industrials sectors.
- The U.S. Dollar (DXY): A strong dollar hurts large multinational companies in the S&P 500 (as their overseas revenue is worth less in USD), but it’s a particular headwind for Materials and Technology, which have significant international exposure.
Tool #3: Breadth and Momentum Indicators – Gauging Internal Health
Don’t just look at the price of the sector ETF. Look under the hood.
- Advance-Decline Line: For a given sector, is the number of advancing stocks outpacing the number of declining stocks? A sector ETF making new highs on a strong A/D line confirms broad participation—a healthy rotation.
- McClellan Oscillator: This volume-weighted breadth indicator can show when money is aggressively moving into or out of a sector, often before the price action makes it obvious.
- RSI and MACD: Apply these standard momentum indicators to your sector ratio charts. An RSI(14) moving above 50 on the XLB/SPY ratio, for example, confirms building momentum for Materials.
Tool #4: Sentiment and News Flow – The Narrative Driver
- Fed Speeches and Reports: The language used by the Fed Chair is parsed for clues about the economic outlook and future policy. A “dovish” turn is a green light for early-cycle sectors.
- Earnings Call Commentary: Listen to the forward guidance from sector bellwether companies. If major industrial CEOs are expressing caution, it’s a data point for a potential late-cycle shift.
- Economic Data Surprises: Use tools like the Citi Economic Surprise Index. When data consistently beats expectations, it fuels mid-cycle sectors. When it consistently misses, it reinforces defensive rotations.
Part 4: A Practical, Step-by-Step Swing Trading Plan
Let’s synthesize everything into a repeatable weekly process.
Step 1: Determine the Macro Backdrop (The “Seasons”)
- Each Sunday night, review the key data from the previous week: Fed policy expectations, CPI, jobs report, and retail sales.
- Ask yourself: “Based on the latest data, where are we most likely positioned on the Sector Rotation Clock?” Form a hypothesis (e.g., “We are in the late-cycle phase, with the Fed still hiking, but growth is slowing”).
Step 2: Scan for Relative Strength (Find the “Current”)
- Use a relative strength heatmap (available on Finviz, StockCharts.com) to visually identify the strongest and weakest sectors over the past 1-4 weeks.
- Create ratio charts for the top 3 strongest and weakest sectors versus SPY. Your hypothesis from Step 1 should align with what you see. (e.g., In your late-cycle hypothesis, you’d expect to see Energy and Staples strengthening, while Technology weakens).
Step 3: Identify the Leading Stocks (Catch the “Wave”)
- Once you’ve identified a strong sector (e.g., Industrials via XLI), drill down into its components.
- Use a stock screener to find stocks within that sector that exhibit:
- Strong relative strength versus both the sector ETF and SPY.
- A technically sound chart pattern (e.g., base breakout, bull flag).
- Strong volume on up days.
- Favorable positioning relative to key moving averages (e.g., above the 20-day and 50-day EMAs).
Step 4: Execute and Manage the Trade
- Entry: Enter on a confirmed breakout from the pattern, preferably with strong volume.
- Stop-Loss: Place a stop-loss below a key support level (e.g., the recent swing low or the 50-day EMA). For a sector rotation trade, a wider stop may be necessary to account for sector-level volatility.
- Profit-Taking: Have a predefined target. This could be a measured move target based on the chart pattern, or you could trail your stop. The most sophisticated method is to exit when the sector’s relative strength ratio begins to roll over. If XLI/SPY breaks its uptrend, it’s time to take profits, even if the individual stock still looks okay.
Read more: Beyond China: Southeast Asia and Mexico Emerge as Top Contenders in US Diversification Strategy
Part 5: Real-World Case Study: The 2023 Rotation into Technology
Let’s analyze a recent example through our framework.
- Context (Late 2022 – Early 2023): The market was in a deep bear market, with the S&P 500 falling due to aggressive Fed rate hikes. The narrative was “imminent recession.” Defensive sectors like Staples and Utilities were holding up relatively well—a classic late-cycle/recession setup.
- The Shift (Q4 2022 – Q1 2023):
- Macro Backdrop: Inflation began to cool from its peak. The market started pricing in a “pause” and eventual “pivot” from the Fed. This is the crucial early-cycle signal.
- Relative Strength: The Technology Select Sector SPDR Fund (XLK) and, even more so, the Invesco QQQ Trust (QQQ), which is tech-heavy, began to show immense relative strength. Their ratio charts (XLK/SPY and QQQ/SPY) bottomed in late 2022 and launched into a steep uptrend in early 2023, dramatically outperforming the market.
- Narrative & Catalyst: The emergence of Generative AI (ChatGPT) provided a powerful, fundamental growth narrative for the sector, justifying the rotation.
- The Trade:
- A swing trader observing the bullish divergence on the XLK/SPY ratio in Q4 2022 would have been alerted.
- The confirmed breakout above the ratio’s 50-day moving average in January 2023 was the entry signal.
- Drilling down, leaders like NVIDIA (NVDA), Microsoft (MSFT), and Meta (META) were breaking out of bases with massive volume.
- A long trade in any of these names, with an exit signal triggered only when the XLK/SPY ratio showed signs of breaking its steep uptrend (which didn’t happen for most of 2023), would have captured a massive trend.
Part 6: Risk Management and Common Pitfalls
Even the best models fail. Protect your capital.
- The Model is a Guide, Not a Gospel: The economic cycle doesn’t always follow the textbook. Be flexible and let price be your ultimate guide.
- Beware of “False Rotations”: Sometimes a sector will pop on a single news event (e.g., a new government policy). Ensure the rotation is confirmed by sustained relative strength and broad participation.
- Over-Diversification: If you’re trading 10 different sectors, you’re not rotating; you’re just replicating the index. Focus your capital on the 1-2 strongest sectors you’ve identified.
- Ignore the Noise: Do not get shaken out of a valid sector trade by a scary headline. Your stop-loss is on the sector ETF ratio chart, not just the daily news cycle.
Conclusion: Becoming a Sector Rotation Navigator
Swing trading sector rotation is a powerful methodology that aligns your portfolio with the market’s most powerful forces. It moves you from being a stock-picker to a capital-allocation expert. By understanding the Sector Rotation Clock, using relative strength as your primary compass, and implementing a disciplined process, you can systematically identify the next leading industry before the crowd.
This approach requires continuous learning, objective analysis, and the emotional discipline to follow the data, not your gut. The market’s currents are always shifting. Your job is not to predict them with perfect accuracy, but to recognize them early, position your boat accordingly, and ride them for as long as they last. Now, take this chart and set sail.
Read more: Friend-Shoring in Action: How US Supply Chains Are Being Rewritten with Allied Nations
Frequently Asked Questions (FAQ)
Q1: What are the best ETFs to track the 11 S&P sectors?
A: The most popular and liquid ones are the State Street SPDR suite:
- Technology (XLK)
- Financials (XLF)
- Healthcare (XLV)
- Consumer Discretionary (XLY)
- Consumer Staples (XLP)
- Energy (XLE)
- Industrials (XLI)
- Materials (XLB)
- Real Estate (XLRE)
- Utilities (XLU)
- Communication Services (XLC)
Q2: How long do typical sector rotations last?
A: It varies widely. A major, cycle-driven rotation can last for many months or even a year or more (e.g., Tech in 2023). Smaller, tactical rotations within a larger cycle can last from a few weeks to a few months. For swing traders, the sweet spot is capturing the middle phase of a rotation that lasts 2-6 months.
Q3: Can I use sector rotation for a long-term investing strategy?
A: Absolutely. The same principles apply but on a longer time frame. Instead of using daily or weekly charts for ratios, long-term investors would use monthly charts. The goal is to make larger, more strategic asset allocation changes in a portfolio rather than frequent swing trades.
Q4: How does Quantitative Easing (QE) and Tightening (QT) affect the model?
A: Profoundly. The post-2008 era of QE distorted traditional cycles by flooding the system with liquidity, which disproportionately benefited growth-oriented sectors like Technology. It’s essential to factor in the prevailing Fed liquidity regime. In a QE environment, the early-cycle phase can be elongated and more powerful for cyclicals and tech.
Q5: What is the single biggest mistake beginners make with sector rotation?
A: They chase a sector after it has already had a massive run-up and is featured on every financial news channel. By then, the easy money has been made, and the rotation may be nearing exhaustion. The key is to identify the rotation in its early stages using relative strength, not headlines.
Q6: Do I need a lot of capital to trade this strategy?
A: No. With the proliferation of ETFs, you can start with a few thousand dollars. You can gain exposure to an entire sector with a single share of an ETF like XLI. The strategy is about the intelligent allocation of capital, not the size of it.