In the relentless arena of day trading, few pursuits are as rewarding—or as daunting—as mastering the intraday price action of the market’s most liquid instruments: US Index ETFs. The SPDR S&P 500 ETF Trust (SPY), the Invesco QQQ Trust (QQQ), and the iShares Russell 2000 ETF (IWM) are the titans that dictate the rhythm of the US market. For the uninitiated, their price charts can seem like chaotic noise. But for the trader who has learned to read the language of the tape, these charts reveal a clear narrative of struggle between bulls and bears, a story told in the subtle shifts of momentum, volume, and key price levels.
This journey “From HOD to LOD”—from the High of the Day to the Low of the Day—is not about finding a magical indicator. It is about developing a deep, intuitive understanding of market structure and participant behavior. It’s a transition from being a passive observer to an active interpreter of the market’s auction process. This guide is your roadmap for that journey.
Understanding Your Battlefield: SPY, QQQ, and IWM
Before diving into price action, it’s crucial to understand the unique personalities of these three ETFs. They are not interchangeable; they represent different segments of the market and, therefore, exhibit different characteristics.
- SPY (The Market Leader): Tracking the S&P 500, SPY is a proxy for the overall health of the US large-cap market. It is the most liquid ETF in the world, which means tight bid-ask spreads and the ability to enter and exit large positions with minimal slippage. Its price action is often “cleaner” and more deliberate than others, as it is influenced by a broad basket of sectors. It moves on macroeconomic data, Federal Reserve policy, and the performance of mega-cap stocks.
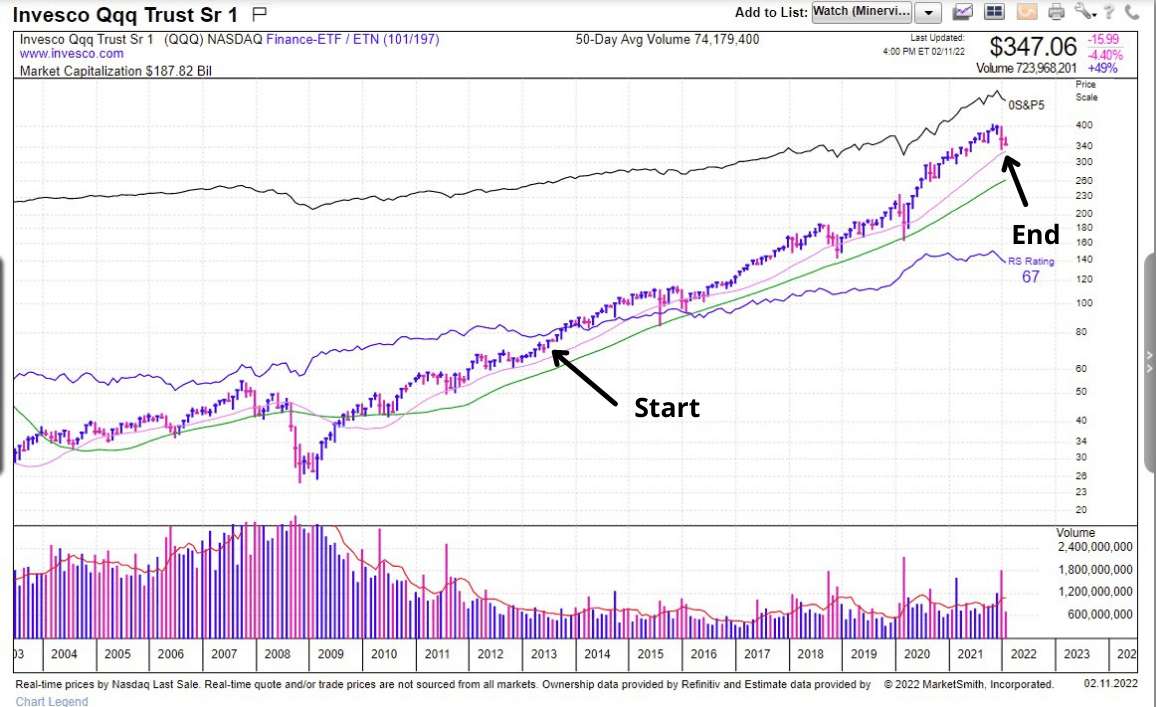
- QQQ (The Tech Rocket): Tracking the Nasdaq-100, QQQ is your window into the world of technology and growth-oriented companies. It is more volatile than SPY, often making larger percentage moves both up and down. Its personality is driven by earnings from tech giants (Apple, Microsoft, Amazon, Nvidia), interest rate expectations (as growth stocks are sensitive to discount rates), and sector-specific news. QQQ is where you find explosive momentum but also sharp, vicious reversals.
- IWM (The Small-Cap Gauge): Tracking the Russell 2000, IWM represents the “risk-on” or “risk-off” sentiment in the market. Small-cap companies are more sensitive to the domestic economic outlook and credit conditions. When investors are optimistic about the US economy, IWM often outperforms. When fear grips the market, it can underperform significantly. Its price action can be “choppier” and less trend-prone than SPY or QQQ due to its lower average daily volume and the diverse nature of its holdings.
A Trader’s Mindset: Your first decision each day should be: which battlefield suits the current environment and my trading style? A volatile, news-driven day might present more opportunity in QQQ, while a range-bound, wait-for-the-Fed day might be better played in SPY.
The Foundation: Market Structure and Key Concepts
Intraday price action analysis is built upon a foundation of core concepts. These are the alphabet of the language you are learning to speak.
1. Market Auction Theory: The “Why” Behind the Move
The market is not a random number generator; it is a continuous auction process. Price moves to discover value. When buyers are more aggressive than sellers, price rises to find a level where sellers will emerge. When sellers are more aggressive, price falls to find a level where buyers will step in. Your entire job is to identify these levels of aggression and imbalance.
2. Support and Resistance: The Battle Lines
- Support: A price level where buying interest is sufficiently strong to overcome selling pressure, halting a decline. It’s a “floor” where demand lives.
- Resistance: A price level where selling interest is sufficiently strong to overcome buying pressure, halting an advance. It’s a “ceiling” where supply resides.
These levels are not thin lines but often zones. They are formed by:
- Previous Day High/Low (PDH/PDL)
- Previous Week High/Low (PWH/PWL)
- Significant Swing Highs and Lows on the intraday chart
- Key Round Numbers (e.g., 450 on SPY)
- Volume-Weighted Average Price (VWAP)
3. Trend and Momentum: The Path of Least Resistance
- Trend: The general direction of the market. The simplest definition of an uptrend is a series of higher highs (HH) and higher lows (HL). A downtrend is a series of lower highs (LH) and lower lows (LL).
- Momentum: The rate of acceleration of a price move. A strong, sustained move on high volume shows powerful momentum. A slow, grinding move on low volume shows weak momentum, often prone to reversal.
4. Volume: The Fuel and the Truth-Teller
Volume confirms the validity of a price move.
- High Volume on Breakouts/Breakdowns: Suggests conviction and participation from institutional players.
- High Volume on Reversals: Indicates a potential climax or exhaustion of the move (e.g., a “selling climax”).
- Low Volume on Pullbacks/Rallies in a Trend: Suggests a lack of conviction against the prevailing trend, implying the trend is likely to continue.
- Divergence: Price makes a new high, but volume is lower than on the previous high. This is a warning sign that the move is losing steam.
5. The Order Book (Level 2 Data) and Time & Sales: The Microscope
While pure price action can be read from a candlestick chart, Level 2 (market depth) and Time & Sales (the tape) provide a real-time ledger of the auction.
- Level 2 shows you the resting limit orders—the walls of buyers and sellers. A large block of sell orders at a resistance level confirms its strength. Seeing those orders get pulled away or “eaten through” quickly can signal a powerful breakout.
- Time & Sales shows you the individual transactions. Large lots (e.g., 1000+ shares in SPY) traded at the ask price indicate aggressive buying. Large lots traded at the bid indicate aggressive selling.
The Intraday Price Action Framework: A Step-by-Step Process
This is a systematic approach to analyzing the market from the opening bell to the close.
Step 1: The Pre-Market Preparation (7:00 AM – 9:30 AM ET)
The battle is won in the preparation. Do not wait for the open to start your analysis.
- Overnight Action & Globex Session: Check where S&P, Nasdaq, and Russell futures (ES, NQ, RTY) closed and how they traded overnight. Did they rally on positive news from Asia or Europe? Did they sell off? This gives you the initial sentiment bias.
- Economic Calendar: What is scheduled for today? Fed speeches, CPI, PPI, Jobless Claims? Know the time and expected impact. A quiet calendar often leads to a technical, range-bound day. A busy one leads to volatility and potential gap-and-go scenarios.
- Key Levels: Identify the most critical support and resistance levels for the day.
- Previous Day High, Low, and Close (PDH, PDL, PDC)
- Globex High and Low
- VWAP from the previous day (often acts as a magnet)
- Significant weekly levels
- Develop a Thesis: Based on your analysis, form a neutral, bullish, or bearish bias for the morning. For example: “The market gapped up overnight on positive earnings but is now approaching the PDH, which was strong resistance yesterday. My initial bias is for a pullback from the PDH unless we see overwhelming volume on the breakout.”
Step 2: The Opening Range (9:30 AM – 10:00 AM ET)
The first 30 minutes are the most volatile and information-rich period of the day. The “Opening Range” (OR) is the high and low established during this time and becomes a critical reference point for the rest of the session.
- Gap Scenarios:
- Gap Up: Price opens above the previous day’s close.
- Fade Scenario: If the gap is large and driven by emotion, and price immediately starts selling off and cannot reclaim the opening high, it may “fill the gap” by moving down to the PDC.
- Gap-and-Go Scenario: If price consolidates near the highs of the OR on strong volume and then breaks above the OR high, it signals strong buying and the trend is likely to continue.
- Gap Down: The inverse logic applies.
- Gap Up: Price opens above the previous day’s close.
- Key Action: Watch how price behaves at the PDL and PDH. A gap down that holds above the PDL and reverses is a strong bullish signal. A gap up that fails at the PDH is a strong bearish signal.
Step 3: The Mid-Day Auction (10:00 AM – 2:00 PM ET)
This is where the real “mastery” of price action occurs. The initial volatility has subsided, and the market begins its true auction process to establish a value area for the day.
- Identify the Developing Value Area: Where is price spending most of its time? This is often around VWAP. Is the market in a clear trend, or is it range-bound?
- Track Swing Points: As the market moves, it will create swing highs and lows. Label them. Are they making HH/HL (uptrend) or LH/LL (downtrend)? This is your objective measure of the trend.
- Use VWAP as a Dynamic Gauge: VWAP is one of the most important intraday indicators.
- In a strong uptrend, price will stay above VWAP, using it as support during pullbacks.
- In a strong downtrend, price will stay below VWAP, using it as resistance during bounces.
- A sharp move from below VWAP to above it (or vice versa) can signal a significant change in sentiment.
- Read the Candlestick Patterns and Momentum:
- Strong Momentum Bars: Large, wide-ranging candlesticks that close near their high (for bulls) or low (for bears) on increasing volume. These show conviction.
- Indecision Bars: Candlesticks with long wicks/shadows on both ends (like a Doji or Spinning Top), especially at key levels, signal a battle between bulls and bears and a potential reversal.
- Climax/Exhaustion: A final, large, high-volume move that seems to “stretch” the price, often followed by an indecision bar. This suggests the move may be over.
Step 4: The Power Hour (2:00 PM – 4:00 PM ET)
The final two hours often see a surge in volume and volatility as institutional traders square off their positions, and the market makes a final commitment to a direction.
- Breakouts/Breakdowns often accelerate during this period.
- Watch for a potential reversal of the mid-day trend if the move was overextended.
- The last hour (3:00 PM – 4:00 PM) can see dramatic moves as traders avoid holding overnight risk.
Putting It All Together: Real-World Scenarios
Let’s synthesize the framework into actionable trade setups.
Scenario 1: The Failed Test of VWAP (A Bearish Continuation Setup)
- Context: SPY is in a clear downtrend, trading below VWAP all morning.
- Setup: After a mid-day selloff, price begins to rally back up. The rally approaches the VWAP.
- Trigger: Price touches or slightly pierces VWAP but shows clear signs of weakness: a long upper wick on the candle, a drop in volume on the approach, and aggressive selling visible on Time & Sales.
- Entry: A short entry on the first bearish candle closing back below VWAP.
- Stop Loss: Just above the high of the candle that tested VWAP.
- Target: The recent swing low, or the LOD.
Scenario 2: The Breakout Retest (A Bullish Continuation Setup)
- Context: QQQ has been consolidating in a tight range below the Previous Day High (PDH) after a gap up.
- Setup: A large, high-volume bull bar breaks decisively above the PDH and the Opening Range high.
- Trigger: Price pulls back from the new highs and retests the now-support level of the former PDH.
- Entry: A long entry as price holds above the breakout level and forms a bullish reversal candle (e.g., a hammer or a bull engulfing).
- Stop Loss: Just below the breakout level.
- Target: A measured move up, often equivalent to the height of the prior consolidation range.
Scenario 3: The Double Top/Bottom Reversal
- Context: IWM rallies twice to the same resistance level (forming two distinct swing highs) but fails to break through.
- Setup: The second high is made on lower volume than the first (divergence) and shows indecision (long upper wick).
- Trigger: Price breaks below the swing low that formed between the two tops.
- Entry: A short entry on the break of the “neckline.”
- Stop Loss: Just above the higher of the two tops.
- Target: A measured move down, approximately the distance from the tops to the neckline.
Risk Management: The Non-Negotiable Discipline
A master of price action is first and foremost a master of risk. Without strict discipline, even the best analysis is worthless.
- The 1% Rule: Never risk more than 1% of your total trading capital on a single trade.
- Consistent Position Sizing: Calculate your position size based on the distance between your entry and your stop loss. This keeps your risk per trade constant.
- Stop-Loss Orders: ALWAYS use a hard stop-loss. It is your insurance policy against a catastrophic loss. Emotional stops do not work.
- Profit-Taking and Scaling: Have a predefined plan for taking profits. One effective method is to scale out: take 50% of your position at your first target, move your stop to breakeven, and let the remainder run towards a second target, trailing your stop.
The Trader’s Psychology: The Inner Battle
Trading from HOD to LOD is a psychological marathon. You will face:
- Fear and Greed: The two greatest enemies. Fear will make you exit winners too early or hesitate on valid setups. Greed will make you hold losers hoping for a turnaround.
- FOMO (Fear Of Missing Out): Chasing a move that is already extended almost always ends badly. Wait for your setup.
- Revenge Trading: Trying to immediately win back losses leads to overtrading and larger losses. After a loss, step away.
- Confirmation Bias: Seeing only the information that supports your existing bias. Adhere to what the price is actually doing, not what you want it to do.
The Antidote is a Trading Plan. Your plan, developed in the calm of pre-market, is your anchor in the storm of intraday volatility. It dictates your entries, exits, and risk. Follow it with robotic discipline.
Conclusion
The journey from simply seeing price moves to understanding the intricate auction process of SPY, QQQ, and IWM is what separates the consistent professional from the hopeful amateur. It requires diligent pre-market preparation, a structured framework for reading intraday action, and, above all, unshakable risk management and psychological discipline.
There is no finish line in this journey. The market is a living entity that constantly evolves. Your mastery lies in your ability to learn, adapt, and remain a humble student of the price action. Study the charts, review your trades, internalize the principles of market structure, and you will gradually transform the apparent chaos into a clear, actionable narrative. You will no longer just be looking at the HOD and LOD; you will be anticipating them.
Read more: The Greenback’s Dominance: Can the US Dollar Maintain Its Status as the World’s Reserve Currency?
FAQ Section
Q1: What time frame charts should I use for intraday trading?
A: Most intraday price action traders use a multi-timeframe approach. A common setup is:
- The 5-minute chart for your primary entry and exit timing.
- The 15-minute or 30-minute chart to identify the broader intraday trend and key levels.
- The 1-minute or 2-minute chart for fine-tuning entries, often in conjunction with Level 2 data.
Q2: Is VWAP the most important indicator?
A: VWAP is arguably the most important dynamic indicator for intraday trading because it incorporates both price and volume, making it a true measure of the day’s average price. However, it should not be used in isolation. Its power comes from its interaction with static support/resistance levels, trend, and volume.
Q3: How can I practice reading price action without risking real money?
A: Paper trading (simulated trading) is an essential first step. Most major brokers offer a robust simulation platform. Spend at least 2-3 months paper trading to apply the framework in this article. Additionally, historical chart replay is a powerful tool. Go back to previous days and practice labeling swing points, trends, and key levels in real-time, then see how the day played out.
Q4: I keep getting stopped out by small, random wicks on candles. What am I doing wrong?
A: This is a common issue. The problem is often placing stops too tightly, without respecting the “noise” of the market. Consider:
- Placing your stop-loss just beyond a key level (e.g., beyond a swing low, not at it), giving the trade a little room to breathe.
- Using the Average True Range (ATR) indicator to gauge recent volatility and set your stop a multiple of the ATR away from your entry.
- Ensuring your entry is precise enough. If you are buying support, don’t buy in the middle of the range; buy as close to the defined support level as possible.
Q5: How do I handle major news events like FOMC or CPI?
A: Price action can become chaotic and illogical around major news. The best strategy for most traders is to avoid trading the initial release (the first 5-15 minutes). The spreads widen, and volatility is extreme. Instead, wait for the market to absorb the news and establish a new, post-news range. Then, you can apply your price action framework to this new environment once liquidity and order return.
Q6: SPY, QQQ, and IWM often move together. Should I trade them all at once?
A: While they are correlated, they are not perfectly in sync. Trading all three simultaneously can lead to overexposure and difficulty managing positions. It’s often better to specialize in one, typically the one that best aligns with your risk tolerance and trading style (e.g., SPY for steadier action, QQQ for more volatility). You can use the others for confirmation. For example, if you see a bullish setup on SPY, check that QQQ and IWM aren’t showing bearish divergence, which could weaken your thesis.