For the uninitiated, the opening bell of the US stock market at 9:30 AM EST is a starting pistol. For the professional day trader, it’s the culmination of hours of meticulous preparation. The chaotic, high-volume first hour of trading—often called the “Power Hour”—is not a time for making decisions; it’s a time for executing a plan that was built in the calm and quiet of the pre-market session.
The difference between consistent profitability and erratic performance in day trading often boils down to a single, non-negotiable discipline: a rigorous pre-market routine. This article is not just a list of tasks; it is a blueprint. It’s a system derived from the collective experience of professional traders, designed to give you a tangible edge. By methodically analyzing the market’s landscape before the open, you transform from a reactive gambler, buffeted by random price swings, into a proactive strategist, poised to capitalize on predictable patterns and momentum.
We will walk you through a comprehensive, step-by-step pre-market checklist, explaining not just what to do, but why it’s critical and how to interpret the information you gather. This is your guide to building the foundation for a successful trading day.
Section 1: The Foundation – Setting the Stage for Success (5:00 AM – 6:30 AM EST)
1.1. Mental and Physical Preparation
Trading is a performance activity, akin to a sport. You wouldn’t run a marathon without hydrating and warming up.
- Adequate Rest: A well-rested brain is crucial for rapid decision-making and emotional control. Fatigue leads to impulsivity and poor risk management.
- Hydration & Nutrition: Dehydration impairs cognitive function. Start with a large glass of water. Avoid a heavy, sugar-loaded breakfast that will cause an energy crash mid-morning.
- Mindfulness/Meditation (5-10 minutes): This is not mystical fluff; it’s mental training. It centers your mind, reduces pre-market anxiety, and builds the mental resilience needed to handle losses and avoid chasing wins.
1.2. Reviewing Your Trading Journal
Before you look at a single chart, look inward. Your trading journal is your most valuable improvement tool.
- Analyze Yesterday’s Trades: What went right? What went wrong? Were your entries precise? Did you follow your exit strategy? Did you let emotions override your rules?
- Identify Patterns: Are you consistently making the same mistake (e.g., moving stop-losses, taking profits too early)? Acknowledge these patterns to consciously avoid them today.
- Set an Intention: Based on your review, set a simple, non-monetary goal for the day. Examples: “I will wait for my A+ setup,” or “I will not take a trade in the first 15 minutes,” or “I will honor my stop-loss on every single trade.”
Section 2: The Macro Scan – Understanding the Market’s Mood (6:30 AM – 7:00 AM EST)
This phase is about gauging the overall market sentiment. Is the environment one of fear, greed, or indecision?
2.1. Overnight and Futures Action
The US market does not exist in a vacuum. The S&P 500 (ES futures), Nasdaq 100 (NQ futures), and Dow Jones (YM futures) trade nearly 24 hours a day. They are your most critical real-time indicator.
- Where are Futures Trading? Compare the current futures price to yesterday’s cash close. Are we up (green) or down (red)? By how much? A 0.5% move is significant.
- Analyze the Overnight Range: Look at the high and low of the overnight session. Where did futures find support and resistance? This often sets up key levels for the regular session.
- Context is Key: A gap up after a multi-day sell-off has a different meaning than a gap up after a multi-day rally. Always connect the pre-market move to the recent price action.
2.2. Key Economic Data and News Catalysts
The market moves on information. You must know what information is being released and how it might impact prices.
- Economic Calendar: Consult a reliable economic calendar (e.g., ForexFactory, Investing.com). Key US data points include:
- CPI (Consumer Price Index) & PPI (Producer Price Index): Major inflation gauges.
- Jobs Report (Non-Farm Payrolls): A huge market mover, released the first Friday of the month.
- Federal Reserve Announcements: Interest rate decisions and commentary are the ultimate market movers.
- Retail Sales, GDP, PMI: Key indicators of economic health.
- Global Market Influence: A sharp sell-off in Asian or European markets (like Germany’s DAX or China’s Shanghai Composite) can create a “risk-off” sentiment that spills over into the US open.
- VIX (Volatility Index): Check the VIX. Is it rising or falling? A rising VIX in the pre-market, especially on a gap down, suggests fear and potential for a volatile open.
Section 3: The Stock-Specific Scan – Finding Your Candidates (7:00 AM – 8:00 AM EST)
Now, we move from the macro to the micro. This is where you identify the specific stocks that are most likely to present high-probability trading setups.
3.1. Identifying the Gappers
“Gappers” are stocks that are trading significantly higher or lower in the pre-market than the previous day’s close. They are the lifeblood of day trading, as they provide immediate momentum and direction.
- Tools: Use your scanner (available in most trading platforms like Trade Ideas, Thinkorswim, or TradingView) to find the top pre-market gainers and losers by percentage.
- Focus on Liquidity and Volume: A 20% gap on 10,000 shares is a trap. A 5% gap on 1 million shares is a potential opportunity. Filter for average daily volume > 1 million shares to ensure you can enter and exit positions easily.
- Categorize the Gappers:
- Up on News: Positive earnings, FDA approval, a new contract. These often have strong, sustained momentum.
- Down on News: Poor earnings, a failed drug trial, negative guidance. These can be great for short-side plays but beware of short squeezes.
- Unexplained Gaps: Gaps without clear news can be technical breakouts or breakdowns. Tread carefully, as the reason may emerge later.
3.2. Analyzing the Catalyst
Never trade a gap blindly. Understand why it’s gapping.
- Earnings Reports: Was the beat massive? Were guidance and revenues also strong? Look beyond the headline EPS number.
- Analyst Upgrades/Downgrades: How influential is the analyst firm (e.g., Goldman Sachs vs. a lesser-known firm)? Was it a downgrade to “Neutral” or a “Strong Sell”?
- Company-Specific News: New product, merger/acquisition, SEC investigation. Read the headline and the key details.
3.3. Performing Technical Analysis on Gappers
The catalyst gives you the narrative; the chart gives you the timing. For each of your top 5-10 gappers, perform the following technical check:
- Pre-Market Price Action: Is the stock continuing to trend in the direction of the gap, or is it fading (retracing)? A stock that gaps up 10% but is now only up 5% is showing weakness.
- Key Support/Resistance Levels:
- For a Gap Up: Where is the nearest resistance? (e.g., prior highs, 200-day moving average). Is the stock gapping through resistance, which is bullish, or gapping up into resistance, which is a potential sell zone?
- For a Gap Down: Where is the nearest support? (e.g., prior lows, key moving averages). Is it gapping through support, which is bearish, or finding a footing at support?
- Volume Confirmation: Is the pre-market volume exceptionally high? High volume confirms institutional interest and gives the move credibility. Low volume gaps are more prone to failure.
Section 4: The Market Internals & Sector Analysis – Gauging Underlying Strength (8:00 AM – 8:30 AM EST)
A stock doesn’t move in a vacuum. Even the best setup can fail if the broader market is working against it.
4.1. Market Breadth
Breadth tells you if the move in the indices is broad-based or being driven by only a handful of large-cap stocks.
- Advancers vs. Decliners: On the NYSE and NASDAQ, how many stocks are up vs. down? A market gap-up with more decliners than advancers is a sign of internal weakness.
- Up Volume vs. Down Volume: What percentage of total volume is flowing into advancing stocks vs. declining stocks? This is an even stronger confirmation tool.
4.2. Sector Heat Map
Is the strength concentrated in a particular sector?
- Identifying Leadership: At the open, money will flow into the strongest sectors. If Technology (XLK) and Consumer Discretionary (XLY) are strong, it’s a “risk-on” environment. If Utilities (XLU) and Consumer Staples (XLP) are leading, it’s a “risk-off” or defensive environment.
- Trading Sympathy Moves: A strong earnings report from one semiconductor stock (e.g., NVDA) can lift the entire sector (SOXX). Identify these potential sympathy plays during your scan.
Section 5: Finalizing Your Game Plan & Risk Management (8:30 AM – 9:25 AM EST)
You have the intelligence. Now, you must form a battle plan. This is the most critical step to avoid emotional, impulsive trading.
5.1. Define Your Watchlist
Narrow your focus. You cannot monitor 50 stocks effectively.
- Primary Watchlist (3-5 stocks): Your A+ candidates with the clearest catalysts, strongest technicals, and highest relative volume.
- Secondary Watchlist (5-7 stocks): B-setups that you’ll only consider if your primary list doesn’t trigger or if market conditions shift.
5.2. Script Your Trades
For each stock on your Primary Watchlist, write down the following:
- Thesis: “Stock XYZ gapped up 8% on strong earnings, is holding above the VWAP in pre-market, and I am long if it breaks the pre-market high of $155.50.”
- Entry Trigger: A specific price level or action. (e.g., “Break of $155.50 on high volume,” or “Pullback to $152.50 with a rejection candle”).
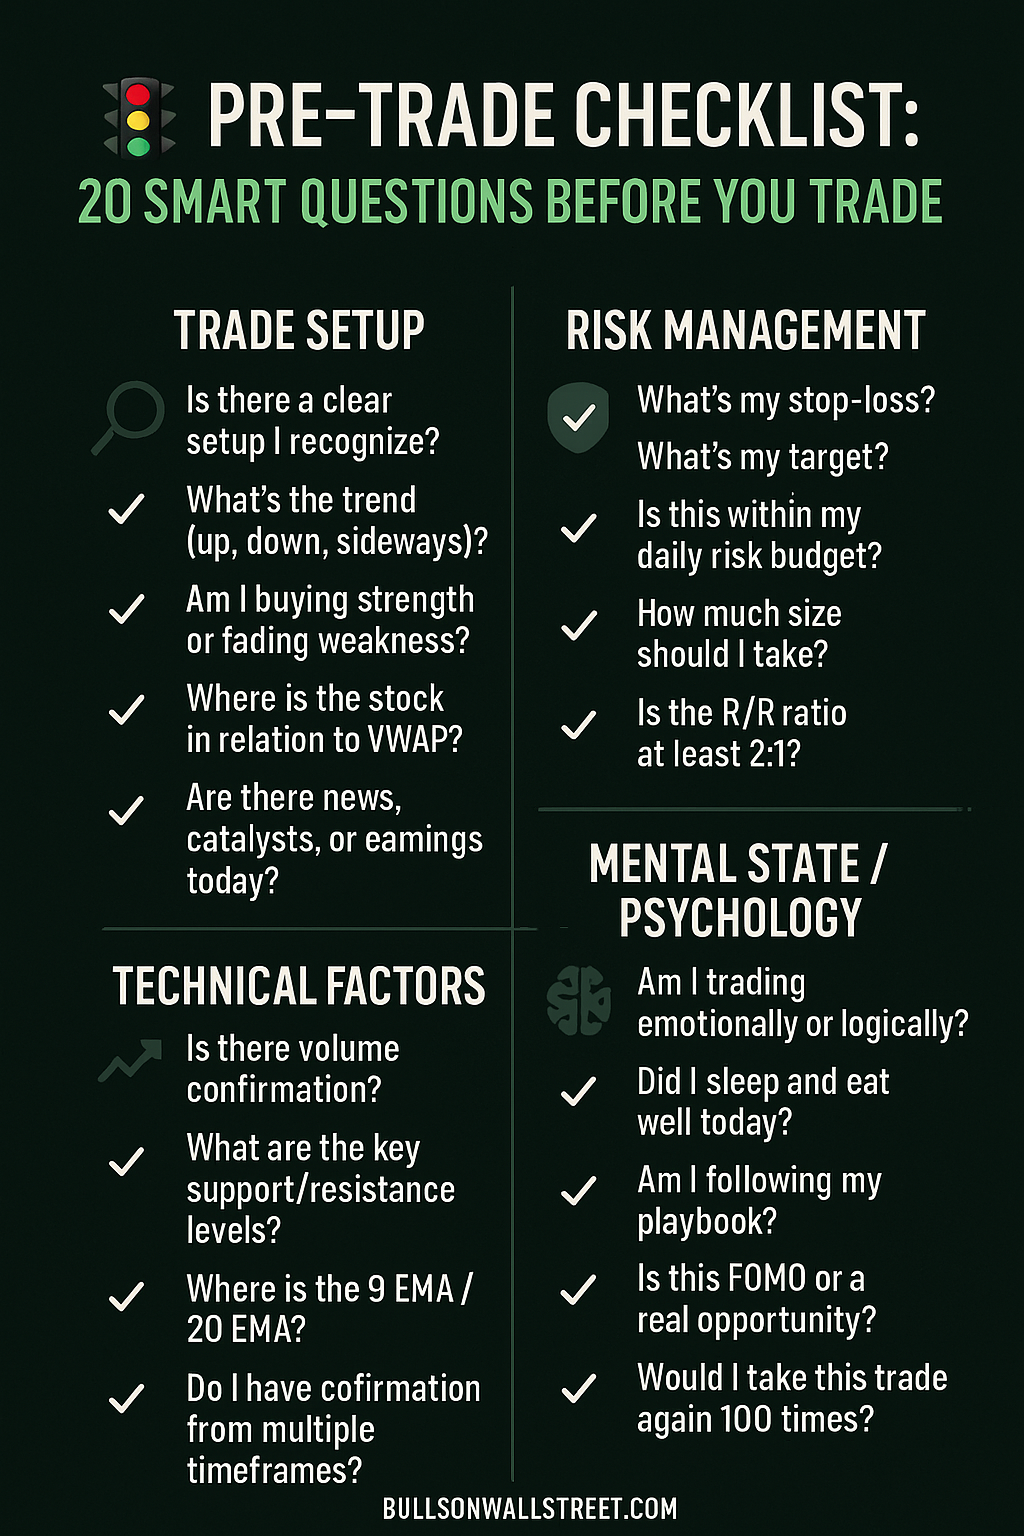
- Stop-Loss: Your predefined exit point if the trade fails. This is non-negotiable. Place it at a logical level where your thesis is invalidated (e.g., below the pre-market low, below a key moving average).
- Profit Target(s): Your predefined exit point(s) for a winning trade. This can be based on a reward-to-risk ratio (e.g., 2:1), a key resistance level, or a trailing stop.
5.3. Final Risk Management Check
- Position Sizing: Based on your account size and risk tolerance, how many shares will you trade? A standard rule is to risk no more than 1-2% of your total account capital on any single trade.
- Example: If you have a $30,000 account, 1% is $300. If your stop-loss on a trade is $1.00 away from your entry, you can trade 300 shares ($300 / $1.00 = 300 shares).
- Maximum Daily Loss: Decide the maximum amount you are willing to lose for the entire day. If you hit this number, you must stop trading and walk away. This protects you from the dreaded “revenge trading” spiral.
Section 6: The Final Countdown – The Last 5 Minutes (9:25 AM – 9:30 AM EST)
- Review Your Plan: Do one final, quick scan of your written game plan.
- Check Futures: Note if there has been a last-minute surge or drop.
- Clear Your Mind: Take a deep breath. The analysis is over. It’s now time for execution.
Section 7: Executing the Open (9:30 AM Onward)
The opening bell rings. Stick to your plan.
- Avoid the First 5-15 Minutes: The initial volatility is often irrational and filled with “market orders” from retail traders. Let the dust settle. Your predefined levels are more likely to hold after this initial frenzy.
- Watch for the Early Trend: Does a clear trend (up, down, or sideways) begin to emerge after the initial chaos?
- Be Patient: If your setup doesn’t trigger, do not force a trade. The market is open for 6.5 hours. There will be other opportunities. The ability to do nothing is a superpower in trading.
Conclusion: The Professional’s Edge
A successful day trader is not a fortune teller; they are a prepared strategist. This comprehensive pre-market checklist is what separates the consistent professional from the hopeful amateur. It transforms the chaotic open from a source of anxiety into a field of opportunity. By dedicating time and disciplined effort before the bell, you arm yourself with knowledge, a plan, and a psychological framework that dramatically increases your odds of success.
This blueprint is not meant to be adopted in its entirety overnight. Start by integrating one or two steps into your routine each week. Build the habit. As this process becomes second nature, you will find yourself entering each trading day with a level of confidence and clarity you never thought possible. The opening bell will no longer be a starting pistol; it will be your cue.
Frequently Asked Questions (FAQ) Section
Q1: I have a full-time job. How can I possibly do all of this before 9:30 AM?
A1: You must adapt and prioritize. Focus on the core elements that provide the most bang for your buck:
- Review Futures & Market Sentiment (10 mins): Are we risk-on or risk-off?
- Scan for Top 5 Gappers (15 mins): Use a simple scanner for the biggest movers by volume and percentage.
- Quick Technical & Catalyst Check (15 mins): Why did they gap? Are they at a key level?
- Define 1-2 Setups with Clear Rules (5 mins): Script your entry, stop, and target for your top candidate.
This condensed 45-minute routine is far better than trading with no preparation.
Q2: What are the most common mistakes traders make in the pre-market?
A2:
- Chasing Gappers: Buying a stock that has already gaped up 40% at the open is a recipe for a trap.
- Ignoring the Overall Market: Trying to go long a small-cap stock when the NQ is down 2% is fighting the tide.
- Overtrading the Watchlist: Adding too many stocks and then feeling pressured to trade them all.
- Trading Without a Catalyst: Taking a position in a gapper without knowing why it’s moving.
- Neglecting Position Sizing: Taking on too much risk on a single trade.
Q3: How important is pre-market volume?
A3: Extremely important. Pre-market volume is a key validator. A large gap on high volume suggests strong institutional interest and makes the move more credible. A large gap on low, retail-driven volume is much more susceptible to a reversal once the institutional money shows up at the open.
Q4: Should I trade in the pre-market session (4:00 AM – 9:30 AM EST)?
A4: For most traders, the answer is no. Pre-market trading has:
- Lower Liquidity: Wider bid-ask spreads, which increases your transaction costs.
- Higher Volatility: Prices can be more easily manipulated by a few large orders.
- Limited Order Types: Many brokers restrict the types of orders you can use (e.g., no stop-loss orders).
It’s generally wiser to use the pre-market session for analysis and wait for the regular session for execution.
Q5: My stock gapped up but is now fading (retracing) in the pre-market. Is this a bad sign?
A5: It’s a sign of weakness and should make you cautious. It indicates that the initial bullish excitement is being met with selling pressure. It doesn’t automatically invalidate a trade, but it means your thesis might need to shift. Instead of a “breakout” play, you might now look for a “pullback to support” play, with a much tighter stop-loss. Always trade what you see, not what you hope to see.