Four times a year, the otherwise methodical flow of the stock market is electrified by a phenomenon known as earnings season. For the average investor, this period can be a source of anxiety, marked by unpredictable price swings and headline risk. But for the disciplined swing trader, earnings season is not a threat—it’s a harvest.
It is a concentrated period where fundamental value collides with market emotion, creating a landscape ripe with high-probability, short-to-medium-term trading opportunities. This playbook is designed to be your guide through this volatility. We will move beyond simplistic “buy the rumor, sell the news” clichés and delve into a structured framework for identifying, analyzing, and executing trades around company earnings reports.
This guide is built on a foundation of experience and a systematic approach to risk. We will cover how to prepare in the weeks leading up to a report, interpret the results and guidance in real-time, and manage your positions in the chaotic, high-volume aftermath. The goal is not to gamble on outcomes, but to trade based on probabilities and disciplined risk management.
Part 1: The Foundation – Understanding the “Why” Behind the Move
Before placing a single trade, it’s crucial to understand the engine of earnings season volatility. Price movements are not random; they are the market’s mechanism for repricing an asset based on new information.
The Three Pillars of an Earnings Report
Every earnings release contains three critical components that the market scrutinizes:
- The Bottom Line (EPS): Earnings Per Share is the headline number. Did the company beat, meet, or miss analyst consensus estimates? A beat or miss is straightforward, but the magnitude matters. A penny beat on lowered expectations is not the same as a 20% beat on strong estimates.
- The Top Line (Revenue): While EPS can be massaged with accounting maneuvers, revenue is harder to fake. It represents the raw demand for a company’s products or services. A revenue miss is often treated more harshly than an EPS miss because it signals fundamental demand issues. Conversely, strong revenue growth, even with a temporary EPS shortfall, can be viewed bullishly if the cause (e.g., heavy investment in growth) is justified.
- Forward Guidance: This is, without exaggeration, often the most important driver of post-earnings price action. The market is a forward-looking machine. Guidance—management’s official forecast for the next quarter or full year—provides the new data points for that machine. A company can beat on EPS and revenue but lower its future guidance, and the stock will almost certainly be punished. Why? Because the “beat” is now seen as a historical artifact, while the lowered guidance indicates future headwinds.
The Psychology of Expectations
The entire game of earnings trading revolves around expectations. Stock prices are not a reflection of a company’s absolute quality but of its performance relative to what the market already expects.
- High Expectations: A stock that has run up significantly into earnings is priced for perfection. Even a modest beat might not be enough to propel it higher (“selling the news”), while any hint of disappointment can trigger a violent sell-off.
- Low Expectations: A stock that has been beaten down, where sentiment is poor and estimates have been lowered, is set up for a positive surprise. A “less bad” report or slightly improved guidance can spark a powerful short-covering rally and a shift in narrative.
The Market’s Reaction Function: The key is to anticipate not just the results, but the reaction to the results. This requires understanding the prevailing narrative surrounding the stock.
Part 2: The Pre-Earnings Playbook – Preparation is 80% of the Battle
Successful earnings trades are built not in the minutes after a report drops, but in the days and weeks leading up to it. This preparation phase is where you build your edge.
Step 1: Building Your Earnings Watchlist
You cannot trade every company that reports. Focus is key. Create a watchlist of 10-20 high-conviction candidates based on:
- Sector Strength: Identify sectors that are in favor or showing relative strength. Are semiconductors breaking out? Is retail showing resilience? Trading with the sector tailwind increases your odds.
- Historical Volatility: Screen for stocks with a history of significant post-earnings moves. Some stocks are known for their “earnings volatility,” which provides the fuel for swing trades.
- Liquidity: Prioritize stocks with high average daily volume. This ensures you can enter and exit positions without significant slippage, especially crucial in the volatile after-hours and pre-market sessions.
- Clear Narrative: Look for companies with a simple, dominant story. For example, is the market focused on their margin expansion, a new product cycle, or their ability to manage costs in an inflationary environment? A clear narrative makes it easier to interpret the report.
Step 2: The Deep Dive – Analyzing the Setup
For each stock on your watchlist, conduct the following analysis:
A. Sentiment and Expectation Analysis:
- Analyst Ratings & Price Targets: What is the consensus analyst rating? Have there been recent upgrades or downgrades? Are price targets being raised or lowered?
- Options Market Activity: Analyze the open interest and volume for options expiring just after earnings. A high volume of out-of-the-money call buying suggests some traders are betting on a big upside move. A skew towards put buying can indicate fear. The “implied move” (the expected price swing priced into the options) is a crucial data point.
- Price Action & Technicals: What is the chart telling you?
- Trend: Is the stock in a clear uptrend, downtrend, or consolidation?
- Key Levels: Identify major support and resistance levels. Where might a bounce or breakdown find fuel?
- Momentum Indicators: Are RSI, MACD, etc., showing overbought or oversold conditions heading into the event?
B. Fundamental Catalyst Identification:
- The Key Metric: Beyond EPS and revenue, what is the one or two metrics the market is most focused on for this specific company?
- Amazon (AMZN): AWS cloud revenue growth and operating margins.
- Netflix (NFLX): Subscriber additions and free cash flow.
- Meta (META): Daily Active Users and advertising revenue per user.
- Tesla (TSLA): Automotive gross margins and delivery guidance.
- Identify this “main character” metric for each of your watchlist stocks.
Step 3: Defining Your Trade Thesis and Plan
Based on your analysis, you will formulate one of several potential theses. You are not predicting the news; you are preparing a reaction plan for different scenarios.
- Thesis A: “Beat and Raise” Setup. You identify a company with strong underlying trends, conservative guidance, and positive momentum that is likely to beat and raise guidance. Your plan is to enter a long position on a confirmed breakout.
- Thesis B: “Pessimism is Overdone” Setup. A stock is in a downtrend, sentiment is awful, but your analysis suggests the negativity is peakish. You anticipate a “less bad” report that could spark a massive short squeeze. Your plan is to buy a breakout above a key resistance level.
- Thesis C: “Sell the Rumor” Setup. A stock has had a massive run-up into earnings, pricing in a perfect report. You anticipate that even a beat may not be enough, and any minor flaw will be punished. Your plan is to enter a short position on a breakdown below a key support level.
Crucially, for each thesis, you must predefine:
- Entry Trigger: What specific price action will trigger your entry? (e.g., “Buy if stock breaks above $150 in pre-market on 2x average volume.”)
- Stop-Loss Level: Where will you admit you are wrong? This is non-negotiable. (e.g., “Place a hard stop at $144, just below the pre-market low.”)
- Profit Target: Based on the implied move and nearby technical levels, where will you take profits? (e.g., “Take 50% off at $162 (50% of the implied move) and trail the rest.”)
Part 3: Execution – Navigating Report Day Chaos
The earnings report is out. The stock is gapping up or down 15% in after-hours trading. This is where discipline separates professionals from amateurs.
Step 1: The Initial Reaction – Don’t Chase!
The first 5-15 minutes after a report are often the most emotional and chaotic. Avoid the instinct to immediately jump in.
- Let the Dust Settle: Allow the initial algorithmic and emotional reaction to play out. A stock can gap up 10%, spike another 5%, and then reverse to close the after-hours session up only 2%. Chasing the initial spike is a recipe for buying at the top.
- Read the Release & Listen to the Call: While the price is moving, your job is to digest the information.
- Scan the Headlines: Identify the key beats/misses on EPS, revenue, and guidance.
- Listen to the Conference Call: Pay particular attention to the Q&A with analysts. This is where the real nuances are revealed. How is management’s tone? Are they confident or defensive? What specific questions are analysts asking?
Step 2: The Gap Analysis Framework
The “gap” from the previous day’s close to the current pre-market or after-hours price is your most important technical feature. How the stock behaves around this gap tells you everything.
- Gap Up Scenarios:
- Bullish: Stock gaps up and continues to trend higher on heavy volume. The previous close acts as support. This is a sign of strong, sustained buying interest.
- Bearish (Failed Breakout): Stock gaps up but immediately fades, filling the gap and trading back towards the previous day’s close or lower. This indicates that the “smart money” is using the strength to sell. This is a classic “sell the news” event.
- Gap Down Scenarios:
- Bearish: Stock gaps down and continues to trend lower on heavy volume. The previous close acts as resistance.
- Bullish (Failed Breakdown): Stock gaps down but immediately finds aggressive buyers, quickly reclaiming the gap and moving back towards the previous close. This is a powerful reversal signal, often indicating the bad news was already priced in.
Step 3: Executing Your Pre-Defined Plan
Now, you refer back to the trade plan you built during your preparation.
- If the price action aligns with your thesis and triggers your entry, place your trade with your pre-defined stop and profit target.
- If the price action does not align with your thesis, or if the trigger is not hit, you do nothing. The most powerful trade is often the one you don’t take. Sitting in cash is a position. Forcing a trade in a chaotic environment is how significant losses occur.
Part 4: Post-Earnings Plays – The Trend is Your Friend
The earnings trade doesn’t always end on the day after the report. Often, the most significant moves occur in the days and weeks that follow as the new information is fully digested by the market.
The Post-Earnings Drift
Academic studies have identified a phenomenon known as “post-earnings announcement drift” (PEAD), where stocks that have surprised significantly continue to trend in the direction of the surprise for several weeks. This provides a secondary swing trading opportunity.
- Strategy: After a strong earnings gap that holds, look for consolidation patterns (e.g., bull flags, pennants) to form over the next 3-5 days. An entry on a breakout from this consolidation can capture the next leg of the “drift.”
- Example: Company X reports, gaps up 12%, and then trades sideways in a tight range for four days. A break above the high of this consolidation range is a high-probability long entry, with a stop placed below the consolidation low.
Managing the Trade
Once you are in a profitable earnings trade, management is key.
- Trailing Stop-Losses: As the trade moves in your favor, systematically raise your stop-loss to lock in profits. A common method is to trail it below a key moving average (like the 9-day or 21-day EMA) or below recent swing lows.
- Scaling Out: As mentioned in the plan, taking partial profits at predefined targets (e.g., 50% at your first target) reduces risk and psychological pressure, allowing you to let the remainder of the position run.
Read more: The Fed’s Next Move: How Interest Rate Decisions Are Reshaping Global Capital Flows into the USA
Part 5: Risk Management – The Bedrock of Survival
Trading earnings is a probabilities game. You will be wrong. Exceptional risk management is what ensures that your losses are small and survivable, while your winners can run.
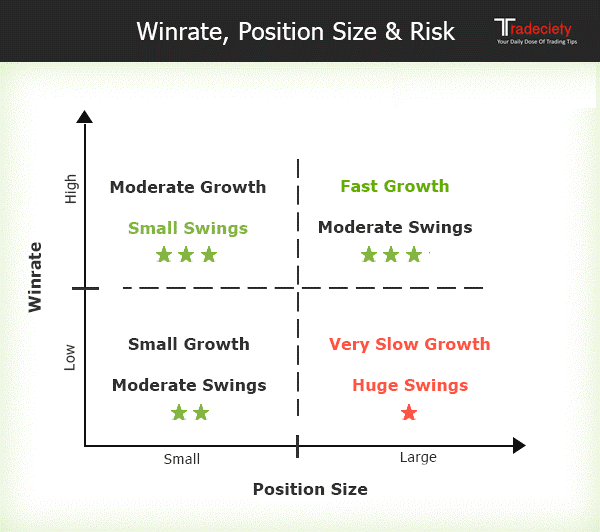
- Position Sizing: This is your most important risk-control tool. Never risk more than 1-2% of your total trading capital on a single earnings trade. Given the high volatility, a position size that feels comfortable in a normal market might be dangerously large during earnings.
- Calculation: Position Size = (Account Risk in $) / (Entry Price – Stop Price)
- The “No Surprise” Stop: Your stop-loss is placed at a level that, if hit, invalidates your original trade thesis. It is not a random number. If the stock moves to that level, your thesis was wrong. Accept it and move on.
- Beware of Illiquidity: Avoid trading in the first and last 10 minutes of the after-hours and pre-market sessions. Spreads widen significantly, and you can get filled at terrible prices. Stick to the most liquid periods.
- The Unexecuted Trade: If you miss your entry trigger, or the market moves too fast, let it go. There will always be another opportunity. Chasing a move almost always results in poor risk/reward.
Conclusion: Mastering the Quarterly Cycle
Earnings season volatility is not a force to be feared, but a dynamic to be understood and harnessed. By adopting the systematic approach outlined in this playbook—rigorous pre-earnings preparation, a disciplined reaction plan, and ironclad risk management—you transform a period of market uncertainty into a structured hunting ground for swing trading opportunities.
Remember, the goal is not to be right on every report. The goal is to have a positive expectancy over a large series of trades. You will have losing trades. The key is to ensure your winners are significantly larger than your losers. Embrace the process, respect the risk, and let the quarterly cycle of earnings become a consistent driver of your trading success.
Frequently Asked Questions (FAQ)
Q1: Is it better to trade before or after an earnings report?
- Trading before (“anticipatory”) is highly speculative and akin to gambling, as you are predicting an unpredictable outcome. It relies on rumors and technical setups alone.
- Trading after (“reactive”) is the method advocated in this playbook. You let the company report the news, assess the market’s initial reaction, and then trade based on the new, confirmed price level and momentum. This is a more probabilistic and disciplined approach.
Q2: What time are earnings reports released?
Most companies release their reports either:
- Pre-Market: Between 7:00 AM and 9:30 AM Eastern Time.
- After-Hours: Between 4:00 PM and 6:00 PM Eastern Time.
The accompanying conference call usually occurs one to two hours after the initial release.
Q3: How can I find out when a company is reporting earnings?
Most financial data platforms have an earnings calendar. Reliable free sources include:
- Yahoo Finance
- Investing.com
- MarketWatch
Your brokerage platform (Fidelity, Schwab, TD Ameritrade, etc.) will also have a detailed earnings calendar.
Q4: What is the biggest mistake new traders make during earnings season?
The single biggest mistake is a lack of position sizing and stop-losses. The extreme volatility can lead to catastrophic losses very quickly if a trade moves against you and you are over-leveraged. The second biggest mistake is chasing price in the first 15 minutes after a report.
Q5: Can I use options to trade earnings?
Yes, but it requires advanced knowledge. Buying plain vanilla calls or puts right before earnings is generally a low-probability strategy due to high implied volatility (IV), which makes options expensive. After the report, IV “crushes,” often evaporating the value of options even if the stock moves in the right direction but not enough. More sophisticated strategies like vertical spreads or iron condors can be used to mitigate the effects of IV crush.
Q6: How do I handle a “gap and go” situation where I miss the entry?
Discipline is key. If you miss your pre-defined entry trigger, do not chase. A “gap and go” often leads to a period of consolidation. Watch for a pullback to a short-term moving average or a breakout from a bull/bear flag pattern in the following days as a secondary, safer entry opportunity.
Q7: What if a company beats on everything but the stock still sells off?
This is common and highlights the importance of expectations and forward guidance. The “beat” may have been less than what was secretly hoped for, or the company’s guidance for the future may have been weak or unclear. The market is always looking forward, and a sell-off on a “beat” tells you that the future outlook, as perceived by the market, has dimmed.