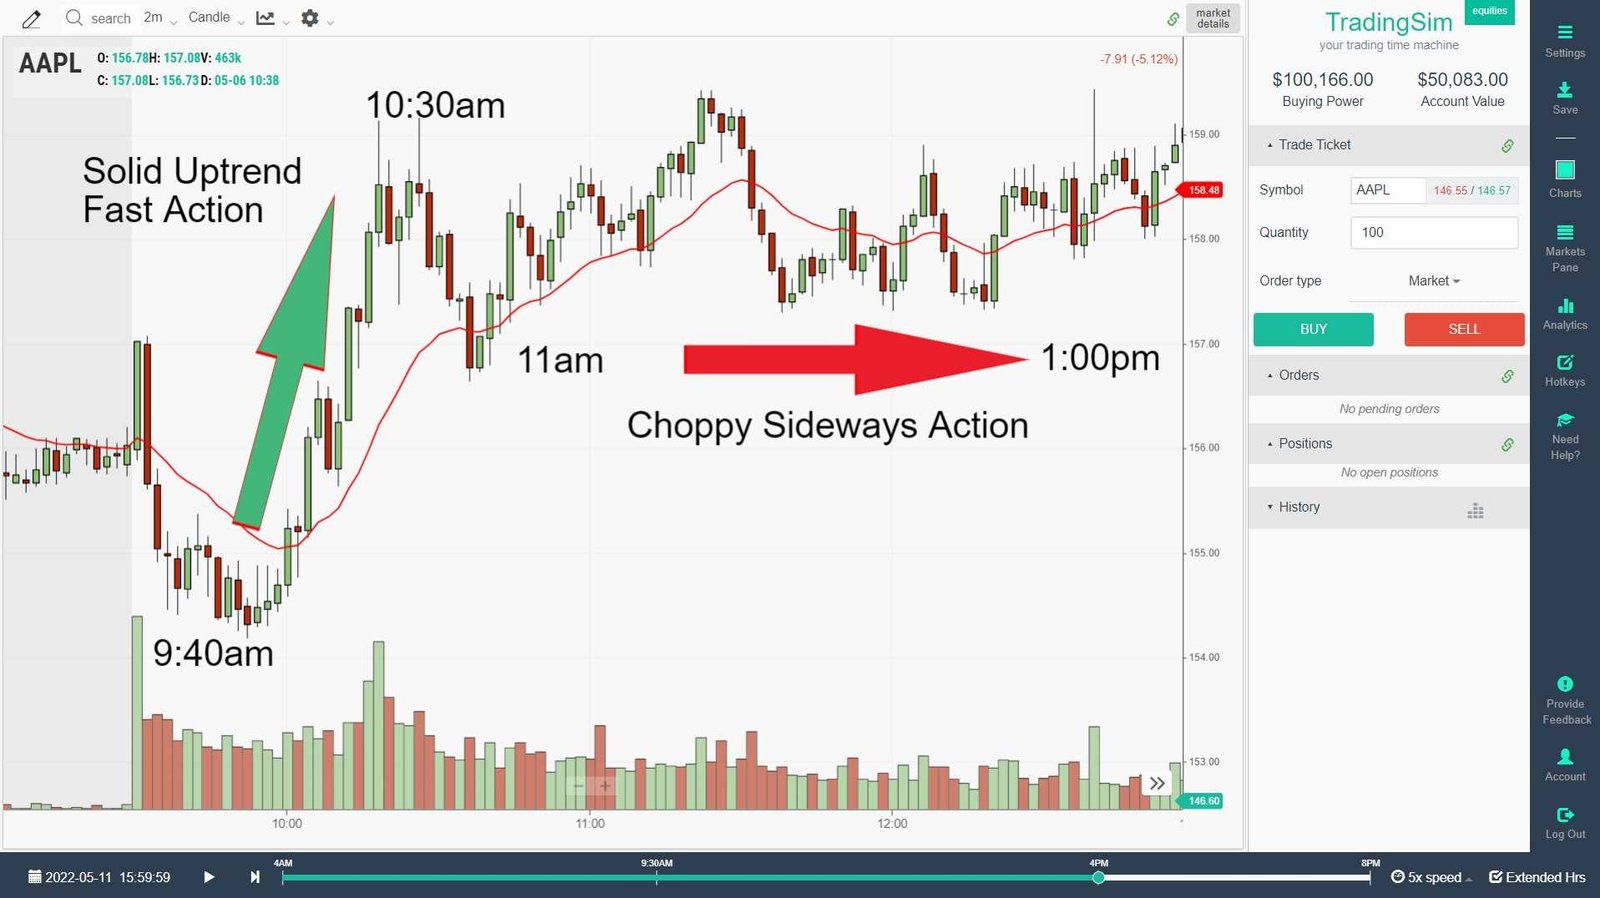
If you’ve spent any time in the day trading world, you’re familiar with the rhythm of the market. The opening bell rings at 9:30 AM EST—a volatile, news-driven frenzy known as the “Open Drive.” Positions are established, and the initial emotional wave either rewards or punishes the overnight risk-takers. Then, around 10:30 AM, a strange quiet often descends. The volume dips, the wild swings subside, and the market seems to catch its breath. For many traders, this is the “midday lull,” a time to step away, grab a coffee, or, worse, force trades out of boredom.
But what if I told you this perceived lull is, in fact, one of the most potent and predictable trading windows of the entire day? What if you could deploy a disciplined, high-probability strategy in just one focused hour to capture the market’s “midday moves”?
Welcome to the 1-Hour Power Hour.
This is not a get-rich-quick scheme. It is a structured, rule-based methodology designed for traders who have other commitments but want an efficient and effective way to participate in the market. It leverages the natural market cycle where the initial noise has faded, and institutional money begins to establish the true trend for the session. This article will serve as your complete guide to understanding, implementing, and mastering this specific strategy, built on a foundation of risk management and psychological discipline.
Section 1: The “Why” – Understanding the Midday Market Mechanics
Before we dive into the “how,” it’s crucial to understand the “why.” A strategy without context is just a set of rules; understanding the market’s engine room gives you the conviction to execute when it matters most.
1. The Opening Bell Fallout (9:30 AM – 10:00 AM EST)
The first 30-60 minutes are dominated by the reaction to overnight news, earnings reports, and economic data. This period is characterized by high volatility and often erratic price action. Market makers and algorithms are adjusting spreads, and retail traders are piling in. It’s a high-risk, high-reward environment that requires quick reflexes and a strong stomach. The Power Hour strategy intentionally avoids this chaos.
2. The Consolidation Phase (10:00 AM – 11:00 AM EST)
As the initial frenzy subsides, the market enters a consolidation phase. The early trend (up, down, or sideways) begins to stall as profit-taking and opposing entries create a balance. This is the market forming a “value area”—a price range where it finds temporary equilibrium. On a chart, you’ll often see the range contract, with lower highs and higher lows, forming a coil or a tight rectangle. This is the preparation phase for our Power Hour.
3. The Power Hour Window (11:00 AM – 12:00 PM EST)
This is our designated trading window. By 11:00 AM, the professional money—institutional desks, hedge funds, and seasoned prop traders—has fully analyzed the morning’s action. They are not reacting to headlines; they are acting on conviction. Their large-volume orders provide the fuel for the next significant move of the day. This is often when the true trend for the session is established or reaffirmed.
- Institutional Participation: Large orders are executed not at the market open, but once a clear direction is perceived, minimizing their market impact.
- Break of Consolidation: The tight range formed between 10:00 and 11:00 AM is a spring being coiled. The break out of this range, especially on increasing volume, signals a commitment to a direction.
- Alignment with Daily Trend: The move that originates during the Power Hour often has the momentum to carry through the afternoon session, sometimes right into the last hour.
By trading this specific window, you are aligning yourself with the most powerful players in the market, sidestepping the opening noise, and focusing your efforts on a high-probability setup.
Section 2: The Trader’s Toolkit – What You Need to Get Started
The Power Hour strategy is streamlined, but it requires the right tools. You don’t need an expensive Bloomberg terminal, but you do need a robust and reliable setup.
1. A Direct-Access Brokerage Platform
Forget the basic apps designed for long-term investing. You need a platform built for active trading. Think Interactive Brokers, TradeStation, Thinkorswim (by Charles Schwab), or Lightspeed. Key features you must have:
- Real-Time Data: Delayed data is a death sentence for day trading.
- Advanced Charting: The ability to plot multiple timeframes, indicators, and draw tools seamlessly.
- Hotkeys: The ability to enter, scale, and exit positions with single keystrokes. Speed and precision are non-negotiable.
- Depth of Market (DOM / Level II): The ability to see the limit order book is critical for confirming institutional involvement.
2. Charting Software & Timeframes
Your primary chart will be the 5-minute chart for entry precision. However, context is everything, so you must monitor three timeframes simultaneously:
- The 15-Minute Chart: To identify the broader intraday trend and key support/resistance levels.
- The 5-Minute Chart (Primary): To pinpoint the consolidation and the exact breakout moment.
- The 1-Minute or 2-Minute Chart: For fine-tuning your entry once the 5-minute signal is given.
3. Key Indicators & Tools
Indicators are your co-pilots, not the pilots. We will use a minimalistic set to avoid analysis paralysis.
- Volume Profile (or at least Simple Volume Bars): This is your most important tool. You need to see if a breakout is occurring on high volume (institutional confirmation) or low volume (a false breakout, or “fakeout”).
- Exponential Moving Averages (EMAs): We will use the 9-period and 21-period EMAs on the 5-minute chart. They help define the short-term trend and dynamic support/resistance.
- VWAP (Volume-Weighted Average Price): The holy grail for many institutional algorithms. A stock trading above VWAP is generally bullish, and below is bearish. We use it as a dynamic trend filter.
- Horizontal Support & Resistance Lines: You must manually draw these at the previous day’s high/low, the pre-market high/low, and the highs/lows of the morning consolidation range.
Section 3: The Core Strategy – A Step-by-Step Playbook for the Power Hour
This is the heart of the methodology. Follow these steps with discipline. The entire process, from analysis to execution, is designed to fit within our one-hour window.
Step 1: The Pre-Market & Open Analysis (8:00 AM – 11:00 AM)
Your Power Hour begins long before 11:00 AM. This is your preparation phase.
- Scan the Market: Identify 3-5 high-relativity stocks or ETFs that are likely to move. Focus on names with high average daily volume (e.g., SPY, QQQ, AAPL, MSFT, TSLA, NVDA) or those reacting to significant news.
- Mark Key Levels: On your charts, draw horizontal lines at:
- Previous day’s high and low.
- Pre-market high and low.
- Overnight gap levels (if applicable).
- Identify the Morning Trend: Did the stock gap up and drift? Gap down and rally? Trade sideways? Understand the narrative of the first 90 minutes.
- Observe the Consolidation (10:00 AM – 11:00 AM): This is critical. Watch for the price to coil into a tight range on the 5-minute chart. The 9 and 21 EMAs should be squeezing together. Volume should be declining during this period. This is the calm before the storm.
Step 2: The Power Hour Trigger (11:00 AM – 12:00 PM)
At 11:00 AM, your focus intensifies. You are now looking for the breakout.
- The Signal: A 5-minute candle must close decisively outside of the consolidation range that was formed between 10:00 AM and 11:00 AM. “Decisively” means it closes near its high (for a long breakout) or low (for a short breakout), and it should do so on a noticeable surge in volume. This volume confirmation is your green light.
- The Trend Filter: The breakout must be in the direction of the broader intraday trend, as defined by the 15-minute chart and the VWAP. For a long trade, the price should be above VWAP. For a short trade, it should be below. This alignment increases the probability of a sustained move.
Step 3: The Entry
Do not chase the price. Your entry is on the first pullback following the confirmed breakout candle.
- After the strong breakout candle, wait for the next 5-minute candle to pull back towards the breakout level (which now becomes your new support for a long trade, or resistance for a short trade).
- Enter your long position as the price bounces off this new support. For a short, enter as the price rejects from the new resistance.
- Use a limit order to get a favorable price on this pullback. Do not use a market order.
Step 4: Risk Management – The Non-Negotiable Foundation
This is what separates professionals from amateurs. Your trade structure is defined before you enter.
- Stop-Loss Placement: Your stop-loss must be placed just on the other side of the consolidation range. For a long trade, place it a few cents below the low of the range. For a short trade, place it a few cents above the high of the range. This invalidates your trade thesis if hit.
- Position Sizing: Your position size should be calculated so that if your stop-loss is hit, you lose no more than 0.5% to 1% of your total trading capital. For example, if you have a $30,000 account, your maximum risk per trade is $300. If your stop-loss is $1.00 away from your entry, you can trade 300 shares ($300 / $1.00 per share risk).
Step 5: The Exit – Taking Profits Systematically
We will use a scaling-out method to lock in profits and let a portion of the trade run.
- Profit Target 1 (T1): Sell 50% of your position when the price reaches a risk-to-reward ratio of 1:1. If you risked $0.50, take profit on half at $0.50 gain. This covers your risk on the entire trade, and you are now playing with “house money.”
- Profit Target 2 (T2): Move your stop-loss on the remaining position to your entry point (breakeven). Now, you have a risk-free trade. Let the remaining 50% run, using a trailing stop or aiming for the next logical resistance level (e.g., the previous day’s high, or a key Fibonacci extension). You can exit the final half when a opposing 5-minute candle closes with high volume, signaling a potential reversal.
Section 4: A Concrete Example in Action
Let’s walk through a hypothetical trade in SPY to crystallize the strategy.
The Setup (Pre-11:00 AM):
- SPY gapped up at the open on positive CPI news. There was an initial push higher until 10:00 AM.
- From 10:00 AM to 11:00 AM, it entered a tight consolidation between $445.50 (support) and $446.00 (resistance). The 9 and 21 EMAs are weaving together, and volume is drying up.
- The 15-minute chart shows the overall trend is bullish, and the price is holding comfortably above VWAP.
The Trigger (11:05 AM):
- The 11:05 AM 5-minute candle bursts through the $446.00 resistance and closes at $446.45. Critically, the volume on this candle is the highest of the last hour. This is our confirmed breakout signal.
The Entry (11:10 AM):
- We don’t chase. We wait for the pullback. The next candle (11:10 AM) pulls back to $446.10, which was the previous resistance and is now our new support.
- We enter a long position at $446.15 using a limit order.
The Trade Management:
- Stop-Loss: The consolidation low was $445.50. We place our hard stop at $445.40.
- Risk Per Share: $446.15 (entry) – $445.40 (stop) = $0.75 risk.
- Profit Taking:
- T1 (1:1 R/R): We sell 50% of our position at $446.90 (entry + $0.75). Risk is now covered.
- T2 (Runner): We move the stop-loss on the remaining shares to breakeven ($446.15). The price continues to climb throughout the afternoon, and we eventually trail a stop and exit the final half at $447.80, capturing a larger move.
Read more: Friend-Shoring in Action: How US Supply Chains Are Being Rewritten with Allied Nations
Section 5: The Trader’s Mindset – The Psychology of the Power Hour
A perfect strategy is useless without the right mindset. The Power Hour demands specific psychological traits.
- Patience: You will do nothing for 90% of the time. You are waiting for one, maybe two, A+ setups. The ability to sit on your hands is a superpower.
- Discipline: You must follow your rules every single time. No moving stops, no revenge trading, no increasing size after a loss. The process is paramount.
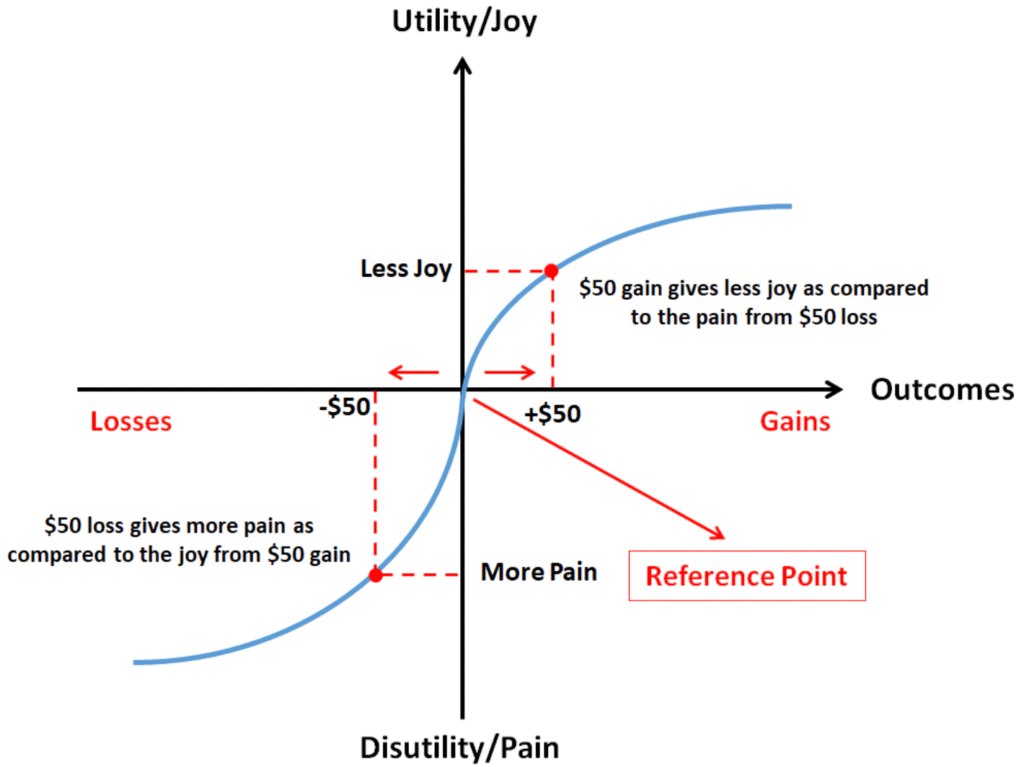
- Objectivity: Do not fall in love with a stock or a direction. The market is never wrong. If your stop is hit, the thesis was wrong. Take the small loss and move on. The goal is to be consistently profitable, not to be “right.”
- Focus: This is a one-hour intense focus session. Eliminate distractions. Turn off social media, silence your phone, and let your family know you are not to be disturbed.
Section 6: Common Pitfalls and How to Avoid Them
- Trading the False Breakout (Fakeout): The #1 pitfall. Avoid it by waiting for the close of the candle and volume confirmation. Low-volume breakouts are often traps.
- Overtrading: There will be days with no clear setup. Forcing a trade on a B- or C-grade setup is a recipe for losses. It’s okay to finish the Power Hour with zero trades. Preservation of capital is a win.
- Revenge Trading: A losing trade is part of the business. Do not immediately jump into another trade to “make it back.” This leads to a downward spiral. If you take a loss, walk away for a while.
- Ignoring the Broader Market: If the overall market (e.g., the S&P 500) is in a strong downtrend, be very cautious about taking long breakouts in individual stocks. The trend is your friend. Don’t fight the tape.
Conclusion: Mastering Your Hour
The 1-Hour Power Hour is more than a strategy; it’s a trading lifestyle. It offers a sustainable approach for those who cannot (and should not) stare at screens all day. It respects your time, your capital, and your sanity by concentrating your efforts on the most statistically favorable window of the day.
Mastery does not come overnight. It requires screen time, practice in a simulator, and relentless self-discipline. But by internalizing the market mechanics, rigorously applying the step-by-step rules, and cultivating the required mindset, you can transform the “midday lull” into your most productive and profitable hour.
The market will always be there. Your job is to wait for it to present you with a gift-wrapped opportunity. The Power Hour is your daily invitation to open it.
Read more: The Fed’s Next Move: How Interest Rate Decisions Are Reshaping Global Capital Flows into the USA
Frequently Asked Questions (FAQ)
Q1: Can this strategy be used in markets other than stocks?
A: Absolutely. The principles of consolidation and breakout are universal. This strategy can be effectively applied to forex (major pairs), futures (like the /ES and /NQ), and even cryptocurrencies, though you must adjust for 24-hour market hours and be aware of different volatility profiles.
Q2: What if I have a full-time job? Can I still use this?
A: The 11:00 AM – 12:00 PM EST window is one of the most accessible for people with day jobs, as it falls during a typical lunch break. However, it requires planning. You must have your platform ready and be able to focus completely for that one hour. If your job does not allow for this, this specific strategy may not be suitable.
Q3: How much capital do I need to start?
A: This is a critical question. In the U.S., if you are classified as a “pattern day trader,” you must maintain a minimum equity balance of $25,000 in your margin account. This is an SEC regulation, not a strategy suggestion. Even if you are not a pattern day trader, you need sufficient capital to position size correctly while adhering to the 1% risk rule. Starting with a live account of less than $10,000 is extremely challenging and not recommended. Practice extensively in a simulator first.
Q4: What do I do on days with high-impact news at 10:00 AM, like the Fed announcement?
A: On days with scheduled high-impact news, the normal market rhythm is thrown out the window. The consolidation and breakout logic may not apply due to extreme volatility and gap-like moves after the news. The best course of action on such days is often to stand aside. The risk is magnified, and the strategy’s edge is diminished. Preserve your capital and trade another day.
Q5: How do I handle a “whipsaw” where the breakout reverses immediately after I enter?
A: This is why your stop-loss is sacred. If the price breaks out, you enter on the pullback, and then it reverses to hit your stop-loss placed below the consolidation, you take the loss. It’s a clean, small loss. This is the cost of doing business. A whipsaw is simply a failed breakout, and your risk management system is designed specifically to handle these scenarios without significant damage to your account.
Q6: Can I use other indicators like the RSI or MACD with this strategy?
A: While you can, the core philosophy of the Power Hour is simplicity and clarity. Adding too many indicators can create conflicting signals and lead to analysis paralysis. The strategy is built on price action, volume, and key EMAs/VWAP. It is recommended to master this core approach before considering adding any other filters. Often, less is more.
Q7: How long should I practice in a simulator before going live?
A: There is no fixed timeline, but a good benchmark is to consistently paper trade the strategy for a minimum of one month (approximately 20 trading days). You should be able to demonstrate profitability in the simulator, not just in terms of P&L, but in your ability to follow your rules without deviation. When your execution becomes mechanical and emotionless in the sim, you can consider transitioning to a small live account.