The US financial markets are a dynamic, 24/7 global ecosystem, but for traders, not all hours are created equal. The rhythm of the trading day presents distinct personalities, each with unique opportunities, risks, and optimal strategies. Understanding these intraday phases is not just an academic exercise; it is a fundamental component of a trader’s edge. Mastering the nuances of the market open, the doldrums of mid-day, and the volatility of the power hour can transform your trading from reactive to strategic.
This definitive guide will dissect the US market hours, providing experienced-based strategies and a deep understanding of the market mechanics at play. We will equip you with the knowledge to navigate each session with confidence, aligning your tactics with the prevailing market character.
The Foundation: Understanding the US Market Session Structure
Before diving into strategies, it’s crucial to understand the basic framework of the trading day. The primary session for the New York Stock Exchange (NYSE) and NASDAQ is from 9:30 AM to 4:00 PM Eastern Time (ET).
However, trading activity extends beyond these hours through pre-market and after-hours sessions:
- Pre-Market: Typically 4:00 AM – 9:30 AM ET. Characterized by lower liquidity and higher volatility, driven by overnight news and earnings reports.
- Regular Trading Hours (RTH): 9:30 AM – 4:00 PM ET. This is the main event, with the highest liquidity, volume, and participant engagement.
- After-Hours (AH): 4:00 PM – 8:00 PM ET. Similar to pre-market, with lower liquidity and heightened volatility, often reacting to post-close news.
For the purpose of this guide, we will focus on the three key phases within the Regular Trading Hours, where the vast majority of retail and institutional volume is concentrated.
Phase 1: The Opening Bell (9:30 AM – 10:30 AM ET) – The Battle for Direction
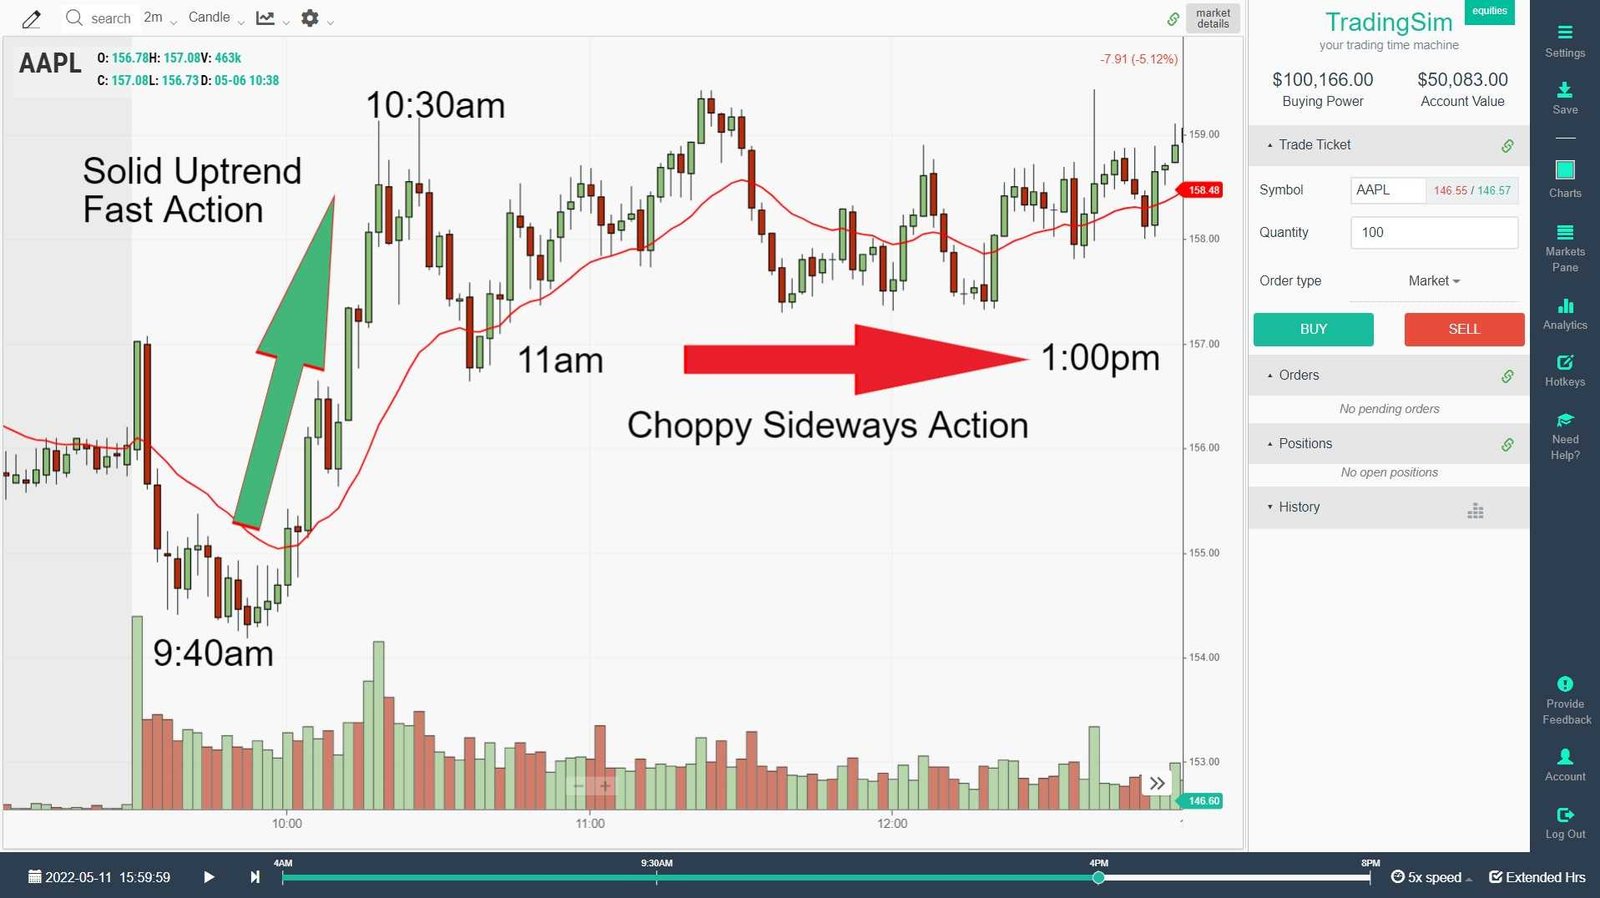
The first hour after the open is often the most volatile and decisive of the entire day. It’s a period of price discovery where the pent-up energy from the pre-market session and overnight global developments collides with the influx of regular-hours traders.
Market Psychology and Mechanics
- Gap Management: Overnight news frequently causes a stock’s opening price to “gap” up or down from the previous day’s close. The initial hour is a battle to either “fill the gap” (return to the prior close) or confirm the new direction.
- Order Flow Imbalance: A flood of market-on-open (MOO) and limit orders from institutions and retail traders creates massive, immediate volume. This imbalance is a key driver of initial momentum.
- Emotional Intensity: Fear of missing out (FOMO) and panic selling are at their peak as traders react to the initial price surge or drop.
Key Strategies for the Market Open
1. The Gap Fade / Gap and Go
This is a classic opening bell strategy that capitalizes on the initial overreaction.
- Gap Fade: If a stock gaps up significantly at the open on no major news, the premise is that the move is overextended. A fade trader would look for signs of weakness (e.g., a bearish reversal candlestick pattern like a shooting star on the 5-minute chart, or a break below the first 5-minute bar’s low) to enter a short position, aiming for the price to retrace and fill the gap towards the previous day’s close.
- Gap and Go: Conversely, if a stock gaps up on exceptionally strong, fundamental news (e.g., a stellar earnings report), the momentum is likely genuine. A “go” trader would wait for a small pullback to establish a new support level and then enter a long position on the resumption of the upward momentum, riding the wave of continued buying.
Risk Management: This is a high-volatility strategy. Use tight stop-losses. For a fade, a stop is placed just above the opening high. For a go, a stop is placed just below the initial pullback low.
2. The First-Hour Breakout
This strategy seeks to capture the new trend that is established after the initial chaos settles.
- Methodology: Instead of trading the first 15-30 minutes of wild swings, the trader waits for the first hour to complete. They then draw a horizontal line at the high and low of that first hour’s trading range.
- Entry: A buy signal is generated when the price breaks above the first-hour high. A sell signal is generated when the price breaks below the first-hour low. The idea is that the market has now decided on a direction for the day.
- Target/Stop: The profit target can be a measured move (e.g., the height of the first-hour range) or a trailing stop. The stop-loss is placed on the other side of the first-hour range.
What to Avoid During the Open
- Chasing the Open: Jumping into a position in the first 5 minutes without a clear plan is often a recipe for getting whipsawed.
- Trading Low-Float, Momentum Stocks: While tempting, these can exhibit extreme, unpredictable volatility that is difficult to manage for all but the most experienced traders.
- Ignoring the Pre-Market Action: The open does not happen in a vacuum. The price levels and volume from the pre-market session provide critical context.
Phase 2: The Mid-Day Lull (10:30 AM – 3:00 PM ET) – The Grind
As the initial frenzy subsides, the market often enters a long, extended period of consolidation. Volume and volatility typically drop significantly. This is when many day traders take a break, but for the patient and disciplined, opportunities still exist.
Market Psychology and Mechanics
- Institutional Lunch Break: A common, though somewhat metaphorical, concept where institutional flow slows down, leading to lower volume.
- Consolidation: The market digests the moves from the morning and builds energy for the final push into the close.
- Range-Bound Action: Without a strong catalyst, indices and stocks often trade in well-defined ranges, bouncing between clear support and resistance levels.
Key Strategies for the Mid-Day Lull
1. Range Trading (The Mean Reversion Play)
This is the quintessential mid-day strategy. It assumes that price will oscillate within a defined channel.
- Methodology: Identify clear support and resistance levels on a 15 or 30-minute chart. These are price levels where the stock has repeatedly bounced or reversed.
- Entry: Buy at or near the identified support level. Sell (or short) at or near the identified resistance level.
- Confirmation: Use oscillators like the Relative Strength Index (RSI) or Stochastic to identify overbought (at resistance) and oversold (at support) conditions to improve your timing.
- Exit: The profit target is the opposite side of the range. Your stop-loss is placed just beyond the support or resistance level, invalidating the range premise if broken.
2. The “Boring” Stock Scan
Use this quiet time for analysis rather than active trading.
- Relative Strength Scans: Run scans to find stocks that are holding up well (or showing weakness) while the overall market is flat or drifting. A stock that is consolidating near its highs of the day while the S&P 500 is down is showing relative strength and could be a prime candidate for a power-hour breakout.
- Watchlist Building: Analyze daily charts, review news, and prepare a focused watchlist for the final hour of trading. This proactive work separates professionals from amateurs.
What to Avoid During the Mid-Day
- Overtrading: The lack of clear direction can lead to “boredom trading,” forcing setups that aren’t there. This erodes capital through commissions and slippage.
- Using Tight, Momentum-Based Strategies: Strategies that rely on high volatility and strong directional moves will often fail during this period, resulting in multiple small losses.
- Ignoring the Bigger Picture: A mid-day range is just a pause within the larger trend. Be aware of whether the consolidation is happening in an uptrend or downtrend, as this biases the eventual breakout direction.
Phase 3: The Power Hour (3:00 PM – 4:00 PM ET) – The Final Push
The last hour of trading is a period of strategic importance that rivals the open. It is characterized by a surge in volume and often, a resumption of volatility as traders and institutions position themselves for the close.
Market Psychology and Mechanics
- Institutional Rebalancing: Mutual and pension funds make large-scale trades to adjust their portfolios before the 4:00 PM pricing deadline.
- Day Trader Exodus: Traders who are flat look to enter new positions for a quick swing, while those who are in positions are actively closing them to avoid overnight risk.
- Trend Acceleration or Reversal: The prevailing trend from the morning often reasserts itself, but it can also be the time for dramatic reversals if the initial move is deemed overdone.
Key Strategies for the Power Hour
1. The Trend Continuation Play
This strategy bets that the dominant intraday trend will strengthen into the close.
- Methodology: Identify the primary trend from the day’s action. Has the market been steadily trending up since 10:30 AM? Or has it been grinding lower?
- Entry: Look for a pullback to a key intraday moving average (e.g., the 21-period EMA on a 5-minute chart) or a minor support/resistance level during the Power Hour. Enter in the direction of the trend as the price resumes its motion.
- Confirmation: Increasing volume on the resumption of the trend is a strong validating signal.
2. The Final Hour Breakout/Breakdown
Similar to the first-hour breakout, this strategy capitalizes on a decisive move that occurs late in the day.
- Methodology: Identify the consolidation range that has formed during the mid-day lull (from, say, 11:00 AM to 2:30 PM).
- Entry: A breakout above the range high or a breakdown below the range low signals a potential end to the consolidation and the start of a new, strong move into the close.
- Rationale: This move is often driven by institutional orders and can carry through to the next day’s open, making it a popular setup for swing traders as well.
Read more: The AI Arms Race: How US Tech Giants are Consolidating Power on the Global Stage
3. The End-of-Day Scalp
For the ultra-short-term trader, the final 15-30 minutes can offer quick, small-profit opportunities.
- Methodology: This involves trading the “micro” fluctuations as market-on-close (MOC) orders flood the market. It requires a very fast execution platform and intense focus.
- Caution: This is an advanced strategy with high risk due to the potential for rapid price swings against your position in thin, but volatile, conditions.
What to Avoid During the Power Hour
- Holding Overnight by Accident: If you are a day trader, ensure all positions are managed to be closed before the bell. The gap risk from overnight news is very real.
- Fading Strong Institutional Moves: If you see massive volume pushing a stock in one direction, it’s often a fool’s errand to stand in front of it. “Don’t fight the tape” is a crucial mantra here.
- Forgetting About News: Be aware of any economic data or earnings reports scheduled for release after the close, as this can cause unusual activity in the affected stocks.
Synthesizing the Day: A Holistic Approach
The most successful traders don’t view these phases in isolation. They see them as interconnected parts of a whole.
- The Open sets the tone.
- The Mid-Day digests the move.
- The Power Hour confirms or denies the day’s narrative.
A strong, high-volume trend that begins at the open, consolidates healthily mid-day, and then resumes with vigor in the power hour presents a very high-probability trend day. Conversely, a chaotic open followed by directionless mid-day action and a weak, low-volume close suggests a lack of conviction and a market searching for direction.
Essential Tools and Mindset for All Phases
Regardless of the strategy, certain tools and disciplines are non-negotiable.
- Volume Analysis: Volume is the fuel behind every move. A breakout on low volume is suspect. A pullback on low volume is healthy. Learn to read volume alongside price.
- The Economic Calendar: Know when major economic data (e.g., CPI, Jobs Report, FOMC Announcements) is scheduled. These events create market-wide volatility that can overwhelm any intraday pattern.
- A Robust Trading Plan: Your plan must define your entry criteria, exit strategy (profit target and stop-loss), and position size for every single trade. Discipline in executing this plan is paramount.
- Risk Management: Never risk more than 1-2% of your trading capital on a single trade. This ensures that a string of losses does not decimate your account.
- Journaling: Record every trade. Note the time of day, strategy used, emotional state, and outcome. Review your journal weekly to identify what’s working and, more importantly, what isn’t.
Read more: The Great Divergence: Can the US Economy Stay Decoupled as Europe and China Slow?
Conclusion
Trading the US market hours is a dynamic chess match, not a random walk. By respecting the distinct character of the market open, mid-day lull, and power hour, you can dramatically improve your timing and selectivity. The open offers high-reward, high-risk momentum plays; the mid-day demands the patience of a range trader; and the power hour provides strategic opportunities to ride the final wave of institutional activity.
There is no single “best” time to trade. The best time is the one that aligns with your personality, strategy, and risk tolerance. Start by specializing in one phase. Master its rhythms, practice your strategies in a simulator, and then, once you have consistent success, consider expanding your toolkit to other parts of the day. The market will always be there. The key is to trade not just often, but well.
Frequently Asked Questions (FAQ)
Q1: I have a full-time job. Can I still be a successful day trader only during the Power Hour?
Absolutely. The Power Hour provides ample volatility and movement for a focused trading session. Many successful traders operate primarily in the first and last hours of the day. The key is to build a strategy specifically tailored to that time frame, such as the final-hour breakout or trend continuation play, and to be fully prepared and focused during that single hour.
Q2: What is the single most important indicator for trading these phases?
While there is no single “holy grail” indicator, volume is arguably the most critical. It validates every move. A breakout on high volume is far more trustworthy than one on low volume. A sell-off on declining volume may signal a lack of conviction. Use price action as your primary guide and volume as your chief confirmer.
Q3: How does the “Triple Witching” Friday impact these phases?
Triple Witching (the simultaneous expiration of stock options, index options, and index futures) occurs quarterly and creates significantly elevated volume and volatility, especially in the final hour. On these days, the normal Power Hour dynamics are amplified. Expect larger-than-normal price swings and reduced predictability. Many traders choose to reduce position size or sit out entirely during these anomalous events.
Q4: Are these strategies applicable to both stocks and index ETFs like the SPY or QQQ?
Yes, the core principles of volatility, volume, and market psychology apply across liquid instruments. In fact, index ETFs like the SPY (S&P 500), QQQ (Nasdaq 100), and IWM (Russell 2000) are excellent vehicles for practicing these intraday phase strategies because of their immense liquidity and clear, trend-following characteristics.
Q5: I keep getting stopped out during the choppy mid-day period. What am I doing wrong?
This is a common issue. You are likely applying a trending or breakout strategy to a market that is range-bound. If the market is clearly choppy and directionless, you have two options: 1) Switch to a range-trading (mean reversion) strategy, buying low and selling high within the channel, or 2) Step away and do not trade. Forcing trades in an environment unsuited to your strategy is a primary cause of “death by a thousand cuts.”
Q6: How much capital do I need to start implementing these strategies?
This is less about a specific dollar amount and more about pattern day trader (PDT) rules in the US. If you are in the US and make four or more day trades in a five-business-day period, you are classified as a PDT and must maintain a minimum account equity of $25,000 in your margin account. Many traders start with more than this minimum to allow for proper position sizing and risk management. Always start in a simulator to prove your strategy before risking real capital.