In the high-stakes arena of short-term trading, where fortunes can be made or lost in seconds, most retail traders are flying blind. They see the candlestick chart—a clean, historical record of price action—and make decisions based on patterns that have already played out. But for the professional trader, the chart is just the photograph. Level 2 data and Time & Sales (T&S) are the live video feed.
These tools, often called “the tape” in a nod to the ticker tapes of old, provide a real-time, unfiltered view into the market’s order book and transaction history. They reveal the hidden forces of supply and demand, the intentions of large institutions, and the subtle shifts in momentum that precede a major price move. Mastering this information is what separates the consistent professional from the reactive amateur.
This guide will demystify Level 2 and Time & Sales, translating the complex matrix of numbers and abbreviations into a clear, actionable language. We will move beyond the basics to explore advanced strategies and the nuanced mindset required to “read the tape” and trade with the confidence of a Wall Street pro.
Part 1: The Foundation – Understanding the Machinery
Before we can interpret the data, we must understand what it represents. The US stock market is not a single entity but a complex ecosystem of competing exchanges and dark pools.
What is the National Best Bid and Offer (NBBO)?
At the very top of any Level 2 window, you’ll find the National Best Bid and Offer (NBBO). This is the single highest price anyone is willing to pay for a stock (the Best Bid) and the single lowest price anyone is willing to sell it for (the Best Ask or Offer) across all regulated exchanges. The difference between these two prices is the Spread.
The NBBO is the legal baseline; your broker is required to execute your market order at the NBBO or better. However, for a trader, it’s only the starting point. The real gold lies in the depth of market data beneath it.
Deconstructing Level 2: The Market’s Order Book
Level 2 data, also known as the Depth of Market (DOM), is a real-time display of all the live, executable limit orders for a given stock. It’s a ledger of intent, showing you who wants to buy, who wants to sell, at what price, and in what quantity.
A typical Level 2 window is split into two sides:
- The Bid Side (Left): A list of all the current highest bids, showing the exchange (e.g., NYSE, NASDAQ, ARCA, BATS), the price, and the size (number of shares) at each price level.
- The Ask/Offer Side (Right): A list of all the current lowest asks, showing the exchange, price, and size.
Key Components of a Level 2 Quote:
- Exchange/Market Maker: The venue where the order resides. Each has a unique identifier (e.g.,
Nfor NYSE,Dfor NASDAQ,Afor ARCA,Pfor NYSE Arca,Xfor NASDAQ OMX BX). Understanding the behavior of different players is crucial (more on this later). - Price: The specific price of the limit order.
- Size: The number of shares available at that price. This is often displayed in lots (where 1 lot = 100 shares). So, a size of “5” typically means 500 shares.
Deconstructing Time & Sales: The Transaction Ledger
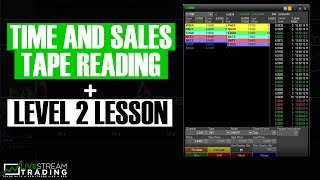
While Level 2 shows you the intentions, Time & Sales shows you the actions. It is a real-time, timestamped record of every single trade that executes.
Each line in the T&S window, or “print,” typically contains:
- Time: The precise time of the transaction (down to the millisecond).
- Price: The price at which the trade occurred.
- Size: The volume of shares traded.
- Exchange: The venue where the trade took place.
- Condition Codes: These are critical. They tell you how the trade occurred (e.g., at the bid, at the ask, between the spread, as part of a block trade).
Part 2: Interpreting the Language of the Tape
Reading Level 2 and T&S is like learning a new language. You’re not just looking at numbers; you’re interpreting the psychology and strategy behind them.
Reading Level 2: The Art of Order Flow
The static display of bids and asks is less important than how they change. You are watching for shifts in size and price that indicate strengthening or weakening conviction.
Key Level 2 Dynamics:
1. Market Maker Games:
Market makers (MMs) like Citadel Securities (CITI), Susquehanna (SUS), and Virtu (VIRT) provide liquidity by constantly posting bids and offers. However, they are not your friends; they are sophisticated participants aiming to profit from the spread and their inventory.
- Fading the Move: When a stock is rising rapidly, you’ll often see MMs on the ask side, but their size will be small and they will quickly “fade” (pull their orders) as the price approaches, making it harder to buy and potentially signaling a lack of genuine bullish conviction.
- Absorption: This is a bullish sign. If a large sell order hits the bid and a market maker absorbs it without the bid price dropping, it indicates a strong buyer is present, defending that price level.
- Stacking the Ask/Bid: When you see a single exchange, often an ECN like ARCA or NASDAQ, post a significantly larger size on the ask than all others, it can be a sign of a large seller trying to cap the price. Conversely, a large bid stack can indicate a large buyer providing support.
Read more: Tax Efficiency Hacks for the American Worker: Keeping More of Your Hard-Earned Money
2. The Wall and The Iceberg:
- The Wall: A massive, static order at a specific price level. A “wall of asks” at $50.00 can act as strong resistance. If buyers cannot absorb it, the price will stall. The key is to watch if the wall gets “eaten.” If it does, it can trigger a sharp, short-covering rally as sellers panic.
- The Iceberg: Large institutional orders are often broken up and hidden to avoid moving the market. What you see on Level 2 is the “tip of the iceberg.” You might see a consistent, repeating size (e.g., 497 shares) reappearing at the bid or ask as it gets filled, indicating a much larger, hidden order lurking beneath the surface.
3. Bid-Ask Spread Dynamics:
- Tight Spread: A spread of 1 cent indicates a highly liquid, actively traded stock. This is the ideal environment for tape reading.
- Wide Spread: A spread of 10 cents or more indicates low liquidity and higher risk. Slippage (the difference between your expected price and your fill price) can be significant. Avoid tape reading in these stocks.
Reading Time & Sales: The Footprints of Money
Time & Sales tells you who is in control: the buyers or the sellers. You are looking for patterns in the size, price, and sequence of trades.
Key T&S Concepts and Patterns:
1. Understanding Condition Codes:
- At the Ask (
ASK) / Green: A trade that executed at the offer price. This is an aggressive buy, as the buyer was willing to pay the seller’s asking price. This is generally bullish. - At the Bid (
BID) / Red: A trade that executed at the bid price. This is an aggressive sell, as the seller was willing to accept the buyer’s bid price. This is generally bearish. - Between the Spread (
SPREAD): A trade that occurred between the bid and ask. This often indicates a negotiation and can be a sign of a large block trade being worked. - Market Maker Close (
MMCL): Indicates a market maker was on the closing side of the trade. Needs context.
2. Identifying Aggression:
The core of tape reading is identifying aggressive vs. passive orders.
- Aggressive Buyer: Uses market orders or marketable limit orders to “lift the ask,” hitting the offers and pushing the price up. You see this as a series of large green prints at the ask.
- Aggressive Seller: Uses market orders to “hit the bid,” slamming the bids and pushing the price down. You see this as a series of large red prints at the bid.
- Passive Buyer: Places a limit order at the bid and waits for sellers to come to them. They are providing support but not pushing the price higher.
- Passive Seller: Places a limit order at the ask and waits for buyers to come to them. They are providing resistance.
3. Key T&S Patterns:
- The Avalanche (Selling Pressure): A relentless series of red prints, often increasing in size, hitting the bid and driving the price lower. The bids will appear thin and get taken out quickly. This is a clear sign to avoid going long.
- The Steamroller (Buying Pressure): A consistent sequence of green prints, lifting the ask. The offers get absorbed, and the price climbs steadily on increasing volume. This confirms bullish momentum.
- The Absorption Print: A large red print hits the bid, but the bid price doesn’t drop. Immediately after, you see a series of smaller green prints. This suggests a large buyer absorbed the selling pressure and is now pushing the price back up. This is a powerful reversal signal.
- The Stop Hunt: A sharp, high-volume spike down, often on large red prints, that quickly reverses. This is often algorithms hunting for clustered stop-loss orders below a key support level. A tape reader can distinguish this from genuine selling by watching for immediate absorption and a swift recovery.
Read more: The American Debt Avalanche vs. Snowball: Which Strategy is Right for You?
Part 3: The Synthesis – Putting It All Together in a Strategy
Level 2 and T&S are powerful individually, but their true potential is unlocked when used together, and in conjunction with your price chart.
The Trinity of Confirmation
For a high-probability trade, seek alignment across all three:
- Price Action (The Chart): Is the stock approaching a key support or resistance level on the 5 or 15-minute chart? Is it breaking out of a consolidation pattern?
- Level 2 (The Intent): Does the order book support the move? On a breakout, are the asks thin and being easily absorbed? Is there a large wall of bids providing support on a pullback?
- Time & Sales (The Action): Is the move being confirmed by aggressive orders? On a breakout, are you seeing a dominance of green prints at the ask? Is the volume substantial?
If all three are telling the same story, you have a strong, confirmed signal. If they are conflicting, the trade premise is weak, and you should avoid it.
A Practical Trading Scenario: The Breakout Play
Let’s walk through a real-world example of a stock attempting to break above the $50.00 resistance level.
Step 1: The Setup (Chart)
The stock has been consolidating in a tight range between $49.80 and $50.00 for the last hour. The chart shows a clear resistance level at $50.00.
Step 2: Watching Level 2 (The Battle)
As the price tests $49.99, you look at Level 2.
- The Resistance: You see a wall of offers at $50.00—5,000 shares on NASDAQ, 3,000 on ARCA. This is the resistance you must overcome.
- The Attack: You notice the size on the ask at $50.00 starts to get “chipped away.” 1,000 shares disappear, then another 500. New, smaller bids start appearing at $49.99 and $49.98, showing buyer interest is building.
- The Break: Suddenly, a large buyer hits the remaining asks at $50.00 with a series of market orders. The wall is gone. The price is now $50.01.
Step 3: Confirming with Time & Sales (The Victory)
You flip your attention to T&S.
- As the wall was being chipped away, you saw a mix of small green and red prints.
- At the moment of the break, you see a flurry of large green prints:
10,000 @ $50.00 ASK,5,000 @ $50.00 ASK. This is the “footprint” of the aggressive buyer. - Now, the stock is at $50.05, and you see continued green prints at the new ask prices. The breakout is confirmed.
Your Entry: The ideal entry was as the large green prints were eating the $50.00 wall, or on the first pullback to $50.01 after the break, provided the Level 2 bids there hold strong.
Part 4: The Professional’s Mindset and Risk Management
Tape reading is an art, not a science. It requires a specific mindset.
- Patience and Selectivity: 90% of the time, the tape is noise. The professional waits for the 10% of moments where the story is clear and the signals align. Do not force trades.
- Context is King: A large green print is meaningless if it occurs at a major resistance level. Always interpret the tape within the context of the broader chart pattern and market environment.
- Emotional Detachment: The tape can be intimidating. Seeing a massive red print can induce panic. You must learn to observe without reacting emotionally. Trust the process, not your gut feeling in the moment.
- It’s a Probability Game: Not every well-setup trade will work. A large buy print could be the last one of the move. This is why risk management is non-negotiable.
Essential Risk Management Rules for Tape Reading:
- Always Use a Stop-Loss: Your stop should be based on the tape and chart. If the price drops back below the breakout level and you see aggressive selling return (red prints), your thesis is invalidated. Get out.
- Position Size Correctly: Tape reading stocks can be volatile. Never risk more than 1-2% of your capital on a single trade.
- Trade Liquid Stocks: Stick to stocks with high average daily volume (over 1-2 million) and tight spreads. Avoid penny stocks and low-float gappers.
- Practice, Practice, Practice: Do not risk real money until you have spent dozens, if not hundreds, of hours watching the tape in a simulator. Most major brokerages offer paper trading platforms that provide real-time Level 2 and T&S data.
Conclusion
Level 2 data and Time & Sales are the ultimate tools for seeing the market in its raw, unfiltered state. They move you from being a passive observer of past price action to an active interpreter of real-time market mechanics and psychology.
While the learning curve is steep, the reward is a profound edge. You will no longer be surprised by breakouts or breakdowns; you will see them developing in real-time. You will learn to feel the market’s rhythm, to distinguish between genuine institutional order flow and deceptive market maker games. You will, in essence, learn to read the tape like a pro.
Start slowly. Focus on one or two liquid stocks each day. Watch how the Level 2 and T&S behave at key chart levels. Be patient, be disciplined, and let the tape tell you its story.
Frequently Asked Questions (FAQ)
Q1: I’m a swing trader holding for days/weeks. Is tape reading relevant for me?
While primarily a day trading tool, tape reading can provide excellent entry and exit timing for swing traders. For example, using the tape to enter a long position on a pullback to support—confirmed by absorption and buying pressure—can significantly improve your entry price versus just using a market order. Similarly, noticing intense selling pressure into a rally can signal an ideal time to take profits.
Q2: Which is more important, Level 2 or Time & Sales?
They are two sides of the same coin, but many professional scalpers would argue that Time & Sales is the ultimate truth-teller. Level 2 shows you intentions (orders that can be canceled), but T&S shows you completed actions (real money changing hands). A large wall on Level 2 might be a bluff; a series of 10,000-share green prints at the ask is a concrete display of buying power.
Q3: What data feed and trading platform do you recommend?
For serious tape reading, you need a professional-grade data feed. Most retail platforms bundle a “Nasdaq TotalView” or “NYSE OpenBook” feed, which is sufficient to start.
- Platforms: Thinkorswim (by Charles Schwab), Interactive Brokers Trader Workstation (TWS), and TradeStation are all excellent choices with robust Level 2 and T&S capabilities.
- Data Feeds: Ensure you subscribe to the real-time Level 2 data package from your broker (there is usually a small monthly fee). The free delayed data is useless for this purpose.
Q4: How can I distinguish between a genuine large buyer and an algorithm?
This is an advanced skill. Often, you can’t definitively separate them, and it doesn’t always matter. The key is the effect. However, algorithmic orders often have a “mechanical” feel—repeating sizes, perfectly timed placements, and rapid fire executions. A genuine large institutional order might be broken up by a human trader or a more complex algorithm, creating a less uniform but more persistent flow. Focus on the net effect of the orders: is their activity consistently pushing the price in one direction?
Q5: I get overwhelmed by the speed of the information. Any tips?
Start by focusing on a single, key price level (e.g., the day’s high or a round number like $50.00). Don’t try to watch every single order. Just watch what happens at that level. Does the size on the offer get eaten? Is it getting hit with large red prints? Simplifying your focus area is the key to managing the initial information overload.
Q6: Are there specific condition codes I should absolutely know?
Yes, focus on the core ones first:
ASK(or@A): Trade at the Ask (Aggressive Buy)BID(or@B): Trade at the Bid (Aggressive Sell)SPREAD: Trade between the Bid and AskMKT(Market Order): Indicates an aggressive order.
Platforms often color-code these, with green for at-the-ask and red for at-the-bid, making them easier to spot.